Cablevision 2013 Annual Report Download - page 59
Download and view the complete annual report
Please find page 59 of the 2013 Cablevision annual report below. You can navigate through the pages in the report by either clicking on the pages listed below, or by using the keyword search tool below to find specific information within the annual report.-
 1
1 -
2
-
3
-
4
-
5
-
6
-
7
-
8
-
9
-
10
-
11
-
12
-
13
-
14
-
15
-
16
-
17
-
18
-
19
-
20
-
21
-
22
-
23
-
24
-
25
-
26
-
27
-
28
-
29
-
30
-
31
-
32
-
33
-
34
-
35
-
36
-
37
-
38
-
39
-
40
-
41
-
42
-
43
-
44
-
45
-
46
-
47
-
48
-
 49
49 -
 50
50 -
 51
51 -
 52
52 -
 53
53 -
 54
54 -
 55
55 -
 56
56 -
 57
57 -
 58
58 -
 59
59 -
 60
60 -
 61
61 -
 62
62 -
 63
63 -
 64
64 -
 65
65 -
 66
66 -
 67
67 -
 68
68 -
 69
69 -
70
-
71
-
72
-
73
-
74
-
75
-
76
-
77
-
78
-
79
-
80
-
81
-
82
-
83
-
84
-
85
-
86
-
87
-
88
-
89
-
90
-
91
-
92
-
93
-
94
-
95
-
96
-
97
-
98
-
99
-
100
-
101
-
102
-
103
-
104
-
105
-
106
-
107
-
108
-
109
-
110
-
111
-
112
-
113
-
114
-
115
-
116
-
117
-
118
-
119
-
120
-
121
-
122
-
123
-
124
-
125
-
126
-
127
-
128
-
129
-
130
-
131
-
132
-
133
-
134
-
135
-
136
-
137
-
138
-
139
-
140
-
141
-
142
-
143
-
144
-
145
-
146
-
147
-
148
-
149
-
150
-
151
-
152
-
153
-
154
-
155
-
156
-
157
-
158
-
159
-
160
-
161
-
162
-
163
-
164
-
165
-
166
-
167
-
168
-
169
-
170
-
171
-
172
-
173
-
174
-
175
-
176
-
177
-
178
-
179
-
180
-
181
-
182
-
183
-
184
-
185
-
186
-
187
-
188
-
189
-
190
-
191
-
192
-
193
-
194
-
195
-
196
 |
 |

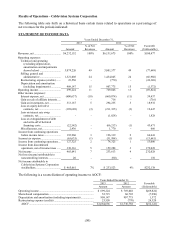
(53)
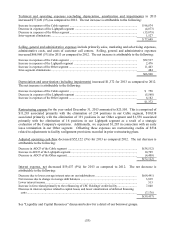
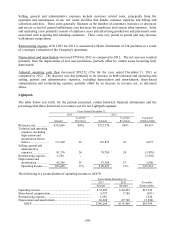
Technical and operating expenses (excluding depreciation, amortization and impairments) in 2013
increased $77,649 (3%) as compared to 2012. The net increase is attributable to the following:
Increase in expenses of the Cable segment ......................................................................................
.
$ 96,874
Decrease in expenses of the Lightpath segment ...............................................................................
.
(4,873)
Decrease in expenses of the Other segment ......................................................................................
.
(15,879)
Inter-segment eliminations...............................................................................................................
.
1,527
$ 77,649
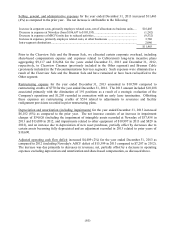
Selling, general and administrative expenses include primarily sales, marketing and advertising expenses,
administrative costs, and costs of customer call centers. Selling, general and administrative expenses
increased $66,960 (5%) for 2013 as compared to 2012. The net increase is attributable to the following:
Increase in expenses of the Cable segment ......................................................................................
.
$52,537
Increase in expenses of the Lightpath segment ................................................................................
.
2,476
Increase in expenses of the Other segment .......................................................................................
.
11,463
Inter-segment eliminations...............................................................................................................
.
484
$66,960
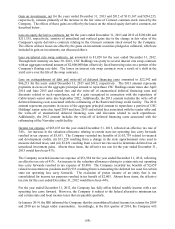
Depreciation and amortization (including impairments) increased $1,372 for 2013 as compared to 2012.
The net increase is attributable to the following:
Increase in expenses of the Cable segment ...................................................................................... $ 750
Decrease in expenses of the Lightpath segment ............................................................................... (5,560)
Increase in expenses of the Other segment ....................................................................................... 6,182
$1,372
Restructuring expense for the year ended December 31, 2013 amounted to $23,550. This is comprised of
$11,283 associated primarily with the elimination of 234 positions in our Cable segment, $10,038
associated primarily with the elimination of 191 positions in our Other segment and $1,558 associated
primarily with the elimination of 16 positions in our Lightpath segment as a result of a strategic
evaluation of the Company's operations. Additionally, we expensed $1,205 in connection with an early
lease termination in our Other segment. Offsetting these expenses are restructuring credits of $534
related to adjustments to facility realignment provisions recorded in prior restructuring plans.
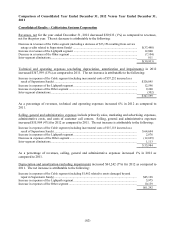
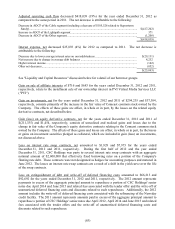
Adjusted operating cash flow decreased $52,122 (3%) for 2013 as compared 2012. The net decrease is
attributable to the following:
Decrease in AOCF of the Cable segment ........................................................................................
.
$(58,512)
Increase in AOCF of the Lightpath segment .....................................................................................
.
10,799
Decrease in AOCF of the Other segment ..........................................................................................
.
(4,409)
$(52,122)
Interest expense, net decreased $59,437 (9%) for 2013 as compared to 2012. The net decrease is
attributable to the following:
Decrease due to lower average interest rates on our indebtedness ..................................................... $(64,441)
Net increase due to change in average debt balances ........................................................................ 3,819
Lower interest income .....................................................................................................................
.
513
Increase in fees related primarily to the refinancing of CSC Holdings' credit facility ......................... 7,848
Decrease in interest expense related to capital leases and lower amortization of deferred financing
costs ............................................................................................................................................. (7,176)
$(59,437)
See "Liquidity and Capital Resources" discussion below for a detail of our borrower groups.