Blizzard 2012 Annual Report Download
Download and view the complete annual report
Please find the complete 2012 Blizzard annual report below. You can navigate through the pages in the report by either clicking on the pages listed below, or by using the keyword search tool below to find specific information within the annual report.-
 1
1 -
 2
2 -
 3
3 -
 4
4 -
 5
5 -
 6
6 -
 7
7 -
 8
8 -
 9
9 -
 10
10 -
 11
11 -
 12
12 -
13
-
14
-
15
-
16
-
17
-
18
-
19
-
20
-
21
-
22
-
23
-
24
-
25
-
26
-
27
-
28
-
29
-
30
-
31
-
32
-
33
-
34
-
35
-
36
-
37
-
38
-
39
-
40
-
41
-
42
-
43
-
44
-
45
-
46
-
47
-
48
-
49
-
50
-
51
-
52
-
53
-
54
-
55
-
56
-
57
-
58
-
59
-
60
-
61
-
62
-
63
-
64
-
65
-
66
-
67
-
68
-
69
-
70
-
71
-
72
-
73
-
74
-
75
-
76
-
77
-
78
-
79
-
80
-
81
-
82
-
83
-
84
-
85
-
86
-
87
-
88
-
89
-
90
-
91
-
92
-
93
-
94
-
95
-
96
-
97
-
98
-
99
-
100
 |
 |

ANNUAL
REPORT
2012
Table of contents
-
Page 1
A N NUA L R EPORT 2012 -
Page 2
OUTSTANDING RESULTS NON-GAAP REVENUES (1) INCREASED 11% YEAR ON YEAR RECORD NON-GAAP OPERATING MARGIN(1) $ 5.0B 34 (1) % For a full reconciliation, see tables at the end of the annual report. -
Page 3
/ 2012 ANNUAL REPORT / 1 $ 1.18 1.3B $ RECORD NON-GAAP EPS (1) OPERATING CASH FLOW INCREASED 27% YEAR ON YEAR INCREASED 41% YEAR ON YEAR LONG-TERM STRATEGY: FOCUS INNOVATION TALENT COMMITMENT ACTIVISION BLIZZARD, INC. -
Page 4
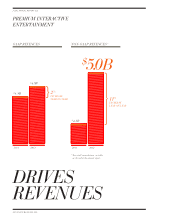
... PREMIUM INTERACTIVE ENTERTAINMENT GAAP REVENUES NON-GAAP REVENUES (1) $ $ 5.0B INCREASE YEAR ON YEAR 4.9B $ 4.8B INCREASE YEAR ON YEAR 2% 11% $ 4.5B 2011 2012 2011 (1) 2012 For a full reconciliation, see tables at the end of the annual report. DRIVES REVENUES ACTIVISION BLIZZARD... -
Page 5
-
Page 6
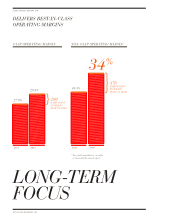
...2012 ANNUAL REPORT / 4 DELIVERS BEST-IN-CLASS OPERATING MARGINS GAAP OPERATING MARGIN NON-GAAP OPERATING MARGIN (1) 34 29.9% 27.9% 30.3% % 370 BASIS POINT INCREASE YEAR ON YEAR 200 BASIS POINT INCREASE YEAR ON YEAR 2011 2012 2011 (1) 2012 For a full reconciliation, see tables at the end... -
Page 7
-
Page 8
... ANNUAL REPORT / 6 QUALITY AND INNOVATION GAAP EPS NON-GAAP EPS (1) $ $1.01 $0.92 1. 1 8 INCREASE YEAR ON YEAR 27 % INCREASE YEAR ON YEAR 10 % $0.93 2011 2012 2011 (1) 2012 For a full reconciliation, see tables at the end of the annual report. DRIVES EPS GROWTH ACTIVISION BLIZZARD... -
Page 9
-
Page 10
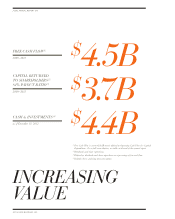
... Capital Expenditures. For a full reconciliation, see tables at the end of the annual report. (2) Dividends and share repurchases. (3) Defined as dividends and share repurchases as a percentage of free cash flow. (4) Includes short- and long-term investments. INCREASING VALUE ACTIVISION BLIZZARD... -
Page 11
-
Page 12
POSITIONED FOR GROWTH ESTABLISHED FRANCHISES NEW INTELLECTUAL PROPERTIES NEW MODELS AND NEW MARKETS -
Page 13
-
Page 14
/ 2012 ANNUAL REPORT / 12 DEAR SHAREHOLDERS: 2012 was an excellent year for Activision Blizzard. In fact, by most of the metrics we use to measure our performance, it was the best year in our history, although it will be difficult to repeat in 2013. Since present management assumed responsibility ... -
Page 15
.... The business models for interactive entertainment on these devices are much less certain than the proven ways we generate returns from our online subscription services, downloadable content for consoles and PCs, and retail console and PC games. So far, most companies making small screen games have... -
Page 16
... list-it evolves as we develop new intellectual property, such as Skylanders® in 2011, or Destiny™. Let's walk through the major drivers of our success in 2012 across Activision Publishing and Blizzard Entertainment. In 2012, the Call of Duty franchise achieved cumulative lifeto-date revenues... -
Page 17
...partner NetEase for the distribution of World of Warcraft in China. In 2012, Blizzard also achieved unprecedented success with Diablo III, which was the #1 best-selling PC game at retail. Including digital sales, it sold more than 12 million copies worldwide through the end of the year and generated... -
Page 18
/ 2012 ANNUAL REPORT / 16 Through Battle.net and other sales of digital content, we continued to achieve significant success in deriving revenue from digital channels, reporting record digital revenues for the calendar year. We were the #1 third-party interactive entertainment Western digital ... -
Page 19
... July 9, 2008 are those of Vivendi Games (see Note 1 of the Notes to Consolidated Financial Statements included in this Annual Report). Therefore, 2012, 2011, 2010, 2009 and 2008 financial data is not comparable with prior periods. The terms "Activision Blizzard," the "Company," "we," "us," and "our... -
Page 20
...fees from individuals playing World of Warcraft®, sales of prepaid subscription cards, and revenue from value-added services such as realm transfers, faction changes and other character customizations within the World of Warcraft gameplay); retail sales of physical "boxed" products; online download... -
Page 21
...year, Blizzard Entertainment had two top-10 PC games in North America and Europe. Diablo III was the #1 best-selling PC game at retail, breaking PC-game sales records with more than 12 million copies sold worldwide through December 31, 2012, and World of Warcraft: Mists of Pandaria® was the #3 best... -
Page 22
... channel-related sales as revenues from subscriptions and memberships, licensing royalties, value-added services, downloadable content, and digitally distributed products. This definition may differ from that used by our competitors or other companies. For the year ended December 31, 2012, our sales... -
Page 23
...profits. Seasonality The interactive entertainment industry is highly seasonal. We have historically experienced our highest sales volume in the year-end holiday buying season, which occurs in the fourth quarter. We defer the recognition of a significant amount of net revenue related to our software... -
Page 24
...the Years Ended December 31, 2012 2011 2010 Net revenues: Product sales ...Subscription, licensing, and other revenues ...Total net revenues ...Costs and expenses: Cost of sales-product costs ...Cost of sales-online subscriptions ...Cost of sales-software royalties and amortization ...Cost of sales... -
Page 25
... tax expense for the years ended December 31, 2012, 2011, and 2010 are presented in the table below (amounts in millions): For the Years Ended December 31, Increase/ (decrease) 2011 2010 2012 v 2011 2012 Increase/ (decrease) 2011 v 2010 Segment net revenues: Activision ...Blizzard ...Distribution... -
Page 26
... on definite-lived intangible assets of $326 million for the year ended December 31, 2010, reflecting a continuing weaker environment for the casual game and music genres. Segment Net Revenues Activision Activision's net revenues increased for 2012 as compared to 2011, primarily due to revenues from... -
Page 27
... a subscription fee or have an active prepaid card to play World of Warcraft, as well as those who have purchased the game and are within their free month of access. Internet Game Room players who have accessed the game over the last thirty days are also counted as subscribers. The above definition... -
Page 28
... For the Years Ended December 31, Increase/ Increase/ (decrease) (decrease) 2012 v 2011 2011 v 2010 2012 2011 2010 % Change 2012 v 2011 % Change 2011 v 2010 GAAP net revenues by distribution channel Retail channels ...Digital online channels(1) ...Total Activision and Blizzard ...Distribution... -
Page 29
... 2011 for Call of Duty®: Black Ops. The decrease was partially offset by the full game download sales of Diablo III and World of Warcraft: Mists of Pandaria, and revenues from Call of Duty Elite memberships. The increase in GAAP net revenues from digital online channels for 2011 as compared to 2010... -
Page 30
... in the fourth quarter of 2011), Diablo III and World of Warcraft: Mists of Pandaria. Sales of Diablo III accounted for the majority of the year-over-year increase in net revenues for the Asia Pacific region. The increase in consolidated net revenues from North America and Asia Pacific was partially... -
Page 31
...total consolidated net revs. Year Ended December 31, 2010 % of total consolidated net revs. Increase/ (decrease) 2012 v 2011 Increase/ (decrease) 2011 v 2010 Platform net revenues: Online subscriptions(1) ...PC and other(2) ...Console Sony PlayStation 3 ...Microsoft Xbox 360 ...Nintendo Wii and Wii... -
Page 32
... sales, partially offset by sales from the Skylanders franchise. Net revenues from PS3 and Xbox 360 increased in 2011 as compared to 2010, primarily due to the launch of Skylanders Spyro's Adventure, the success of the Call of Duty franchise, and downloadable content packs for Call of Duty: Black... -
Page 33
...and Blizzard segments due to higher revenues. Total cost of sales decreased in 2011 as compared to 2010, primarily due to the continued change in mix for products with fewer hardware peripherals, and accordingly lower product costs; an increasing number of products distributed through digital online... -
Page 34
...a future game under development; however, the write-off of capitalized software development was slightly less than in 2010. Sales and Marketing (amounts in millions) Increase (Decrease) 2012 v 2011 Increase (Decrease) 2011 v 2010 Year Ended December 31, 2012 % of consolidated net revs. Year Ended... -
Page 35
...value of a financial liability relating to a contingent earn-out liability from a previous acquisition and there was no such item during 2011. Income Tax Expense (Benefit) (amounts in millions) Increase (Decrease) 2012 v 2011 Increase (Decrease) 2011 v 2010 Year Ended December 31, 2012 % of Pretax... -
Page 36
... the business combination, the favorable tax attributes of Vivendi Games carried forward to the Company. In late August 2012, VHI settled a federal income tax audit with the Internal Revenue Service ("IRS") for the tax years ended December 31, 2002, 2003, and 2004. In connection with the settlement... -
Page 37
... releases of Diablo III and World of Warcraft: Mist of Pandaria during 2012 contributed to the higher cash inflows for 2010 and 2012 as compared to 2011, when there were no major releases from Blizzard. Additionally, the strong performance of Activision's Skylanders franchise and Call of Duty: Black... -
Page 38
... of our common stock and restricted stock units in connection with our annual dividend. In addition, cash flows used in financing activities for the year ended December 31, 2012 reflect the repurchase of $315 million of our common stock and the payment of $16 million in taxes relating to the vesting... -
Page 39
... the accuracy of information they provide that is utilized in the preparation of our periodic public reports filed with the SEC. Financial results and other financial information also are reviewed with the Audit Committee of the Board of Directors on a quarterly basis. As required by applicable... -
Page 40
... of revenues and expenses during the reporting period. Actual results could differ from those estimates and assumptions. The impact and any associated risks related to these policies on our business operations are discussed throughout Management's Discussion and Analysis of Financial Condition and... -
Page 41
... to open and/or future invoices. The conditions our customers must meet to be granted the right to return products or price protection include, among other things, compliance with applicable trading and payment terms, and consistent return of inventory and delivery of sell-through reports to us. We... -
Page 42
... of capitalized intellectual property license costs relating to such contracts may extend beyond one year. We evaluate the future recoverability of capitalized software development costs and intellectual property licenses on a quarterly basis. For products that have been released in prior... -
Page 43
...do not meet the threshold of "more likely than not" that they will be realized in the future, a valuation allowance is recorded. Management believes it is more likely than not that forecasted income, including income that may be generated as a result of certain tax planning strategies, together with... -
Page 44
... in this Annual Report for additional information regarding the determination of the impairment charges recorded for the year ended December 31, 2010. We did not record an impairment charge to our definite-lived intangible assets as of December 31, 2012 and 2011. FASB literature related to the... -
Page 45
... to our employees and senior management vest based on the achievement of pre-established performance or market goals. We estimate the fair value of performance-based restricted stock rights at the closing market price of the Company's common stock on the date of grant. Each quarter, we update our... -
Page 46
... In February 2013, the FASB issued an accounting standards update requiring new disclosures about reclassifications from accumulated other comprehensive loss to net income. These disclosures may be presented on the face of the statements or in the notes to the consolidated financial statements. The... -
Page 47
... rates, foreign currency exchange rates and market prices. Foreign Currency Exchange Rate Risk We transact business in many different foreign currencies and may be exposed to financial market risk resulting from fluctuations in foreign currency exchange rates. Revenues and related expenses generated... -
Page 48
... in Rules 13a-15(f) and 15d-15(f) under the Exchange Act. Our management, with the participation of our principal executive officer and principal financial officer, conducted an evaluation of the effectiveness, as of December 31, 2012, of our internal control over financial reporting using the... -
Page 49
... for each of the three years in the period ended December 31, 2012 in conformity with accounting principles generally accepted in the United States of America. Also in our opinion, the Company maintained, in all material respects, effective internal control over financial reporting as of December 31... -
Page 50
... and contingencies (Note 17) Shareholders' equity: Common stock, $0.000001 par value, 2,400,000,000 shares authorized, 1,111,606,087 and 1,133,391,371 shares issued at December 31, 2012 and 2011, respectively ...Additional paid-in capital ...Retained earnings ...Accumulated other comprehensive loss... -
Page 51
ACTIVISION BLIZZARD, INC. AND SUBSIDIARIES CONSOLIDATED STATEMENTS OF OPERATIONS (Amounts in millions, except per share data) For the Years Ended December 31, 2012 2011 2010 Net revenues Product sales ...Subscription, licensing, and other revenues ...Total net revenues ...Costs and expenses Cost of... -
Page 52
ACTIVISION BLIZZARD, INC. AND SUBSIDIARIES CONSOLIDATED STATEMENTS OF COMPREHENSIVE INCOME (Amounts in millions) For the Year Ended December 31, 2012 2011 2010 Net income...$1,149 Other comprehensive income (loss): Foreign currency translation adjustment ...46 Unrealized gains on investments, net ... -
Page 53
ACTIVISION BLIZZARD, INC. AND SUBSIDIARIES CONSOLIDATED STATEMENT OF CHANGES IN SHAREHOLDERS' EQUITY For the Years Ended December 31, 2012, 2011, and 2010 (Amounts and shares in millions) Retained Earnings (Accumulated Deficit) Accumulated Other Comprehensive Income (Loss) Common Stock Shares ... -
Page 54
...503) Capital expenditures ...(73) (Increase) decrease in restricted cash ...(2) Net cash (used in) provided by investing activities ...(124) Cash flows from financing activities: Proceeds from issuance of common stock to employees...33 Tax payment related to net share settlements of restricted stock... -
Page 55
... fees from individuals playing World of Warcraft), sales of prepaid subscription cards, and revenue from value-added services such as realm transfers, faction changes, and other character customizations within the World of Warcraft gameplay, retail sales of physical "boxed" products; online download... -
Page 56
... operations before income tax expenses" in our Blizzard segment, Europe region, and online subscriptions as pres ented in footnote 13 of the notes to consolidated financial statements by $11 million. There was no impact to operating cash flows. The adjustment increased the "Deferred revenues" on our... -
Page 57
.... We generally do not require collateral or other security from our customers. We had one customer for the Activision and Blizzard segments, GameStop, who accounted for approximately 10% and 12% of net revenues for the years ended December 31, 2012 and 2010, respectively. We did not have any single... -
Page 58
... of capitalized intellectual property license costs relating to such contracts may extend beyond one year. We evaluate the future recoverability of capitalized software development costs and intellectual property licenses on a quarterly basis. For products that have been released in prior... -
Page 59
... financial performance, and changes in economic conditions could result in future impairment charges. We test acquired trade names for possible impairment by using a discounted cash flow model to estimate fair value. We have determined that no impairment has occurred at December 31, 2012 and 2011... -
Page 60
... the new accounting standard has not had a material impact on our financial statements. Product Sales We recognize revenue from the sale of our products upon the transfer of title and risk of loss to our customers and once any performance obligations have been completed. Certain products are sold to... -
Page 61
...the first month of free usage that is included with the World of Warcraft boxed software, the World of Warcraft end user may enter into a subscription agreement for additional future access. Revenues associated with the sale of subscriptions via boxed software and prepaid subscription cards, as well... -
Page 62
... to open and/or future invoices. The conditions our customers must meet to be granted the right to return products or price protection include, among other things, compliance with applicable trading and payment terms, and consistent return of inventory and delivery of sell-through reports to us. We... -
Page 63
... related advertisement is ran for the first time. Advertising expenses for the years ended December 31, 2012, 2011, and 2010 were $396 million, $343 million, and $332 million, respectively, and are included in "Sales and marketing expense" in the consolidated statements of operations. Income Taxes... -
Page 64
... to our employees and senior management vest based on the achievement of pre-established performance or market goals. We estimate the fair value of performance-based restricted stock rights at the closing market price of the Company's common stock on the date of grant. Each quarter we update our... -
Page 65
...long-term investments classified as availablefor-sale at December 31, 2012 (amounts in millions): Amortized cost Fair Value At December 31, 2012 U.S. government agency securities and corporate bonds due in 1 year or less...$398 Auction rate securities due after ten years ...8 $406 $398 8 $406 47 -
Page 66
... and intellectual property licenses are comprised of the following (amounts in millions): For the Years Ended December 31, 2012 2011 2010 Amortization ...$205 Write-offs and impairments ...12 7. Restructuring $258 60 $322 63 On February 3, 2011, the Board of Directors of the Company authorized... -
Page 67
... years ended December 31, 2012, 2011, and 2010, respectively. 10. Goodwill The changes in the carrying amount of goodwill by reporting unit for the years ended December 31, 2012 and 2011 are as follows (amounts in millions): Activision Blizzard Distribution Total Balance at December 31, 2010...Tax... -
Page 68
...years ended December 31, 2012, 2011, and 2010, respectively. The gross carrying amount as of December 31, 2011 in the tables above reflect a new cost basis for license agreements, game engines and internally developed franchises due to impairment charges for the year ended December 31, 2010. The new... -
Page 69
... Subtopic 360-10. This resulted in impairment charges of $67 million, $9 million and $250 million to license agreements, game engines and internally developed franchises intangible assets, respectively, recorded within our Activision segment for the year ended December 31, 2010. 12. Current Accrued... -
Page 70
... years ended December 31, 2012, 2011, and 2010 is based on the location of the selling entity. Net revenues from external customers by geographic region were as follows (amounts in millions): Years Ended December 31, 2012 2011 2010 Net revenues by geographic region: North America ...Europe ...Asia... -
Page 71
... Consolidated Financial Statements. 14. Computation of Basic/Diluted Earnings Per Common Share The following table sets forth the computation of basic and diluted earnings per common share (amounts in millions, except per share data): Years Ended December 31, 2012 2011 2010 Numerator: Consolidated... -
Page 72
...business combination, the favorable tax attributes of Vivendi Games, Inc. carried forward to the Company. In late August 2012, VHI settled a federal income tax audit with the Internal Revenue Service ("IRS") for the tax years ended December 31, 2002, 2003, and 2004. In connection with the settlement... -
Page 73
... reinstated retroactively to January 1, 2012, and is now scheduled to expire on December 31, 2013. The Company will record the impact of the extension of the R&D tax credit related to the tax year ended December 31, 2012, as a discrete item the first quarter of 2013. The impact of the extension of... -
Page 74
... of the Business Combination agreement, occurred immediately prior to the close of the Business Combination. This difference has resulted in no additional payment to Vivendi and no impact to our consolidated statement of cash flows for the years ended December 31, 2012, 2011, and 2010. Vivendi Games... -
Page 75
... approximately $10 million related to the settlement of tax audits and/or the expiration of statutes of limitations in the next twelve months. Although the final resolution of the Company's global tax disputes, audits, or any particular issue with the applicable taxin g authority is uncertain, based... -
Page 76
... transact business in various currencies other than the U.S. dollar and have significant international sales and expenses denominated in currencies other than the U.S. dollar, subjecting us to currency exchange rate risks. To mitigate our risk from foreign currency fluctuations we periodically enter... -
Page 77
...normal course of business, we enter into contractual arrangements with third parties for non-cancelable operating lease agreements for our offices, for the development of products and for the rights to intellectual property. Under these agreements, we commit to provide specified payments to a lessor... -
Page 78
..., the Company, in consultation with outside counsel, examines the relevant facts and circumstances on a quarterly basis assuming, as applicable, a combination of settlement and litigated outcomes and strategies. Moreover, legal matters are inherently unpredictable and the timing of development... -
Page 79
... for future issuance under the 2008 Plan. Shares issued in connection with awards made under the 2008 Plan are generally issued as new stock issuances. Method and Assumptions on Valuation of Stock Options Our employee stock options have features that differentiate them from exchange-traded options... -
Page 80
...of stock-based payment awards at the grant date depends upon the accuracy of the model and our ability to accurately forecast model inputs as long as ten years into the future. These inputs include, but are not limited to, expected stock price volatility, risk-free rate, dividend yield, and employee... -
Page 81
... of Mr. Kotick's employment agreement with the Company, in each case subject to the Company attaining the specified compound annual total shareholder return target for that vesting period. If the Company did not achieve the market performance measure for a vesting period, no performance shares would... -
Page 82
... 2012 Stock Repurchase Program. For the year ended December 31, 2012, we repurchased in total 26 million shares of our common stock for an aggregate purchase price of $315 million pursuant to stock repurchase plans authorized in 2011 and 2012. On February 3, 2011, our Board of Directors authorized... -
Page 83
... 12, 2011, the Company made dividend equivalent payments of $2 million related to that cash dividend to the holders of restricted stock units. On February 10, 2010, Activision Blizzard's Board of Directors declared a cash dividend of $0.15 per common share payable on April 2, 2010 to shareholders of... -
Page 84
..., net" at December 31, 2012 2011, and 2010, respectively. Others Activision Blizzard has entered into various transactions and agreements, including cash management services, investor agreement, tax sharing agreement, and music royalty agreements with Vivendi and its subsidiaries and affiliates... -
Page 85
25. Quarterly Financial and Market Information (Unaudited) For the Quarters Ended September 30, June 30, 2012 2012 December 31, 2012 March 31, 2012 (Amounts in millions, except per share data) Net revenues ...Cost of sales...Operating income ...Net income...Basic earnings per share ...Diluted ... -
Page 86
... 31, 2012. For periods prior to July 9, 2008, before the Business Combination, the share price information for the Company is for Activision, Inc. In connection with the Business Combination, Activision, Inc. changed its name to Activision Blizzard, Inc. and changed its fiscal year end from March... -
Page 87
... 1, 2012, the Company made dividend equivalent payments of $3 million related to that cash dividend to the holders of restricted stock units. On February 9, 2011, our Board of Directors declared a cash dividend of $0.165 per common share payable on May 11, 2011 to shareholders of record at the close... -
Page 88
... Board of Directors. There can be no assurances that dividends will be declared in the future. Return of capital to Vivendi related to settlement of pre-Business Combination Taxes Prior to the Business Combination in 2008, Vivendi Games' income taxes were presented in the financial statements as if... -
Page 89
... table provides the number of shares purchased and the average price paid per share during each quarter of 2012, the total number of shares purchased as part of our publicly announced share repurchase programs, and the approximate dollar value of shares that could still be purchased under our stock... -
Page 90
..., earnings or loss per share, cash flow or other financial items; (2) statements of our plans and objectives, including those relating to product releases; (3) statements of future financial or operating performance; and (4) statements of assumptions underlying such statements. Activision Blizzard... -
Page 91
...Three Months Ended December 31, 2012 and 2011 (Amounts in millions) Three Months Ended December 31, 2011 Amount % of Total December 31, 2012 Amount % of Total GAAP Net Revenues by Segment/Platform Mix Activision and Blizzard: Online subscriptions1 PC and Other5 Sony PlayStation 3 Microsoft Xbox 360... -
Page 92
... 30, 2011 September 30, 2011 December 31, 2011 March 31, 2012 Year over Year % Increase (Decrease) Three Months Ended June 30, September 30, 2012 2012 December 31, 2012 976 27 949 Year over Year % Increase (Decrease) 15% 8 15 Cash Flow Data Operating Cash Flow Capital Expenditures Non-GAAP Free... -
Page 93
... 4,337 57 % $ 34 91 316 (103) 213 Year Ended December 31, 2011 Amount % of Total $ Increase (Decrease) % Increase (Decrease) GAAP Net Revenues by Distribution Channel Retail channel Digital online channels1 Total Activision and Blizzard 12 % (6) 5 (27) 2 Distribution Total consolidated GAAP net... -
Page 94
... 31, 2012 Amount % of Total $ 2,436 1,968 452 4,856 50 % 41 9 100 2,405 1,990 360 4,755 50 % 42 8 100 $ $ 31 (22) 92 101 Year Ended December 31, 2011 Amount % of Total $ Increase (Decrease) % Increase (Decrease) 1% (1) 26 2 GAAP Net Revenues by Geographic Region North America Europe Asia Pacific... -
Page 95
...interactive entertainment products and contents. Blizzard - Blizzard Entertainment, Inc. and its subsidiaries ("Blizzard") publishes PC games and online subscription-based games in the MMORPG category. Activision Blizzard Distribution ("Distribution") - distributes interactive entertainment software... -
Page 96
... between common shareholders and participating security holders. Net income attributable to Activision Blizzard Inc. common shareholders used to calculate non-GAAP earnings per common share assuming dilution was $870 million and $1,322 million for the three months and year ended December 31, 2012 as... -
Page 97
... between common shareholders and participating security holders. Net income attributable to Activision Blizzard Inc. common shareholders used to calculate non-GAAP earnings per common share assuming dilution was $715 million and $1,071 million for the three months and year ended December 31, 2011 as... -
Page 98
... between common shareholders and participating security holders. Net income attributable to Activision Blizzard Inc. common shareholders used to calculate non-GAAP earnings per common share assuming dilution was $646 million and $982 million for the three months and year ended December 31, 2010 as... -
Page 99
... Boulevard Santa Monica, California 90405 ANNUAL REPORT ON FORM 10-K Activision Blizzard's Annual Report on Form 10-K for the calendar year ended December 31, 2012 and amendments thereto are available to shareholders without charge upon request by calling our Investor Relations department at (310... -
Page 100
3100 OCEAN PARK BOULEVARD SANTA MONICA, CALIFORNIA 90405 T: (310) 255-2000 F: (310) 255-2100 WWW.ACTIVISIONBLIZZARD.COM