Blackberry 2013 Annual Report Download - page 178
Download and view the complete annual report
Please find page 178 of the 2013 Blackberry annual report below. You can navigate through the pages in the report by either clicking on the pages listed below, or by using the keyword search tool below to find specific information within the annual report.-
 1
1 -
2
-
3
-
4
-
5
-
6
-
7
-
8
-
9
-
10
-
11
-
12
-
13
-
14
-
15
-
16
-
17
-
18
-
19
-
20
-
21
-
22
-
23
-
24
-
25
-
26
-
27
-
28
-
29
-
30
-
31
-
32
-
33
-
34
-
35
-
36
-
37
-
38
-
39
-
40
-
41
-
42
-
43
-
44
-
45
-
46
-
47
-
48
-
49
-
50
-
51
-
52
-
53
-
54
-
55
-
56
-
57
-
58
-
59
-
60
-
61
-
62
-
63
-
64
-
65
-
66
-
67
-
68
-
69
-
70
-
71
-
72
-
73
-
74
-
75
-
76
-
77
-
78
-
79
-
80
-
81
-
82
-
83
-
84
-
85
-
86
-
87
-
88
-
89
-
90
-
91
-
92
-
93
-
94
-
95
-
96
-
97
-
98
-
99
-
100
-
101
-
102
-
103
-
104
-
105
-
106
-
107
-
108
-
109
-
110
-
111
-
112
-
113
-
114
-
115
-
116
-
117
-
118
-
119
-
120
-
121
-
122
-
123
-
124
-
125
-
126
-
127
-
128
-
129
-
130
-
131
-
132
-
133
-
134
-
135
-
136
-
137
-
138
-
139
-
140
-
141
-
142
-
143
-
144
-
145
-
146
-
147
-
148
-
149
-
150
-
151
-
152
-
153
-
154
-
155
-
156
-
157
-
158
-
159
-
160
-
161
-
162
-
163
-
164
-
165
-
166
-
167
-
 168
168 -
 169
169 -
 170
170 -
 171
171 -
 172
172 -
 173
173 -
 174
174 -
 175
175 -
 176
176 -
 177
177 -
 178
178 -
 179
179 -
 180
180 -
 181
181 -
 182
182 -
 183
183 -
 184
184 -
 185
185 -
 186
186 -
 187
187 -
 188
188 -
189
-
190
-
191
-
192
-
193
-
194
-
195
-
196
-
197
-
198
-
199
-
200
-
201
-
202
-
203
-
204
-
205
-
206
-
207
-
208
-
209
-
210
-
211
-
212
-
213
-
214
-
215
-
216
-
217
-
218
-
219
-
220
-
221
-
222
-
223
-
224
-
225
-
226
-
227
-
228
-
229
-
230
-
231
-
232
-
233
-
234
-
235
 |
 |

Research In Motion Limited
Management’s Discussion and Analysis of Financial Condition and Results of Operations
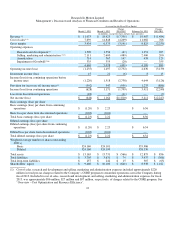
The following table sets forth certain consolidated statement of operations data expressed as a percentage of revenue for the periods
indicated:
13
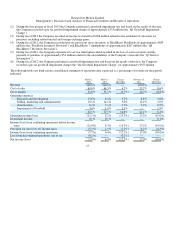
(2) During the first quarter of fiscal 2013 the Company performed a goodwill impairment test and based on the results of that test,
the Company recorded a pre-tax goodwill impairment charge of approximately $335 million (the “Q1 Goodwill Impairment
Char
g
e”).
(3) During fiscal 2013 the Company recorded an income tax benefit of $166 million related to the settlement of uncertain tax
p
ositions, includin
g
related interest and forei
g
n exchan
g
e
g
ains.
(4) During fiscal 2012, the Company recorded pre-tax provisions on its inventory of BlackBerry PlayBooks of approximately $485
million (the “PlayBook Inventory Provision”) and BlackBerry 7 smartphones of approximately $267 million (the “Q4
BlackBerr
y
7 Inventor
y
Provision”).
(5) During fiscal 2012, the Company experienced a service interruption which resulted in the loss of service revenue and the
payment of penalties of approximately $54 million related to the unavailability of the Company’s network (the “Q3 Service
Interru
p
tion”).
(6) During fiscal 2012, the Company performed a goodwill impairment test and based on the results of that test, the Company
recorded a
p
re-tax
g
oodwill im
p
airment char
g
e (the “Q4 Goodwill Im
p
airment Char
g
e”) of a
pp
roximatel
y
$355 million.
March 2,
2013
March 3,
2012
Change
2013/2012
February 26,
2011
Change
2012/2011
Revenue
100.0% 100.
0
%
—
100.
0
%
—
Cost of sales
69.0% 64.3% 4.7% 55.7%
8.6%
Gross mar
g
in
31.0% 35.7% (4.7%) 44.3% (8.6%)
O
p
eratin
g
ex
p
enses
Research and develo
p
ment
13.6% 8.4% 5.2% 6.8% 1.6%
Sellin
g
, marketin
g
and administration 19.1% 14.1% 5.0% 12.1%
2.0%
Amortization
6.4% 3.1% 3.3% 2.2% 0.9%
Im
p
airment of Goodwill
3.0% 1.9% 1.1%
—
1.9%
42.1% 27.5% 14.6% 21.1% 6.4%
O
p
eratin
g
income (loss)
(11.1%) 8.2% (19.3%) 23.2%
(15.0%)
Investment income
0.1% 0.1%
—
—
0.1%
Income (loss) from continuing operations before income
taxes
(11.0%) 8.3% (19.3%) 23.2%
(14.9%)
Provision for (recover
y
of) income taxes (5.3%) 1.9% (7.2%) 6.2% (4.3%)
Income (loss) from continuin
g
o
p
erations (5.7%) 6.4% (12.1%)
17.
0
% (10.6%)
Loss from discontinued o
p
erations, net of tax (0.2%)
—
(0.2%)
—
—
Net income (loss)
(5.9%) 6.4% (12.3%) 17.
0
% (10.6%)