Big Lots 2012 Annual Report Download - page 2
Download and view the complete annual report
Please find page 2 of the 2012 Big Lots annual report below. You can navigate through the pages in the report by either clicking on the pages listed below, or by using the keyword search tool below to find specific information within the annual report.-
 1
1 -
 2
2 -
 3
3 -
 4
4 -
 5
5 -
 6
6 -
 7
7 -
 8
8 -
 9
9 -
 10
10 -
 11
11 -
 12
12 -
 13
13 -
14
-
15
-
16
-
17
-
18
-
19
-
20
-
21
-
22
-
23
-
24
-
25
-
26
-
27
-
28
-
29
-
30
-
31
-
32
-
33
-
34
-
35
-
36
-
37
-
38
-
39
-
40
-
41
-
42
-
43
-
44
-
45
-
46
-
47
-
48
-
49
-
50
-
51
-
52
-
53
-
54
-
55
-
56
-
57
-
58
-
59
-
60
-
61
-
62
-
63
-
64
-
65
-
66
-
67
-
68
-
69
-
70
-
71
-
72
-
73
-
74
-
75
-
76
-
77
-
78
-
79
-
80
-
81
-
82
-
83
-
84
-
85
-
86
-
87
-
88
-
89
-
90
-
91
-
92
-
93
-
94
-
95
-
96
-
97
-
98
-
99
-
100
-
101
-
102
-
103
-
104
-
105
-
106
-
107
-
108
-
109
-
110
-
111
-
112
-
113
-
114
-
115
-
116
-
117
-
118
-
119
-
120
-
121
-
122
-
123
-
124
-
125
-
126
-
127
-
128
-
129
-
130
-
131
-
132
-
133
-
134
-
135
-
136
-
137
-
138
-
139
-
140
-
141
-
142
-
143
-
144
-
145
-
146
-
147
-
148
-
149
-
150
-
151
-
152
-
153
-
154
-
155
-
156
-
157
-
158
-
159
-
160
-
161
-
162
-
163
-
164
-
165
-
166
-
167
-
168
-
169
-
170
-
171
-
172
 |
 |

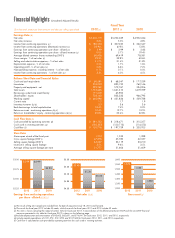
Financial Highlights (Unaudited Adjusted Results)
(a) The results of Big Lots Canada are included from the date of acquisition (July 18, 2011) and forward.
(b) The results for fiscal year 2012 include 53 weeks, while the results for fiscal years 2011 and 2010 include 52 weeks.
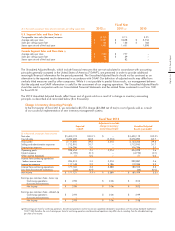
(c) This item is shown excluding the impact of certain items for fiscal year 2012. A reconciliation of the difference between GAAP and the non-GAAP financial
measures presented in this table for fiscal year 2012 is shown on the following page.
(d) Includes depreciation and amortization of $95,602, $82,851, and $74,041 for fiscal years 2012, 2011, and 2010, respectively.
(e) Includes capital expenditures of $131,273, $131,293, and $107,563 for fiscal years 2012, 2011, and 2010, respectively.
(f) Cash flow is calculated as cash provided by operating activities less cash used in investing activities.
$3.00
$2.75
$2.50
$2.25 201020112012
$2.99 $2.99
$2.83
1,600
1,550
1,500
1,450
1,400
1,350
1,300 201020112012
1,574
1,533
1,398
$5.5B
$5.3B
$5.0B
$4.8B
$4.5B 201020112012
$5.4B
$5.2B
$5.0B
Net sales (a) (b)Earnings from continuing operations
per share - diluted (a) (b) (c)
Store count (a)
Fiscal Year
($ in thousands, except per share amounts and sales per selling square foot) 2012 (a) 2011 (a) 2010
Earnings Data (b)
Net sales $ 5,400,119 $ 5,202,269 $ 4,952,244
Net sales increase 3.8% 5.0% 4.8%
Income from continuing operations (c) $ 180,553 $ 207,235 $ 222,547
Income from continuing operations (decrease) increase (c) (12.9)% (6.9)% 13.8%
Earnings from continuing operations per share - diluted (c) $ 2.99 $ 2.99 $ 2.83
Earnings from continuing operations per share - diluted increase (c) 0.0% 5.7% 19.4%
Average diluted common shares outstanding (000's) 60,476 69,419 78,581
Gross margin - % of net sales (c) 39.3% 39.8% 40.6%
Selling and administrative expenses - % of net sales 31.7% 31.4% 31.8%
Depreciation expense - % of net sales 2.0% 1.7% 1.6%
Operating profit - % of net sales (c) 5.6% 6.6% 7.2%
Non-operating expense, including interest - % of net sales 0.1% 0.1% 0.0%
Income from continuing operations - % of net sales (c) 3.3% 4.0% 4.5%
Balance Sheet Data and Financial Ratios
Cash and cash equivalents $ 60,581 $ 68,547 $ 177,539
Inventories
918,023 825,195 762,146
Property and equipment - net 593,562 572,767 524,906
Total assets 1,753,626 1,641,310 1,619,599
Borrowings under bank credit facility 171,200 65,900 –
Shareholders’ equity 758,142 823,233 946,793
Working capital $ 460,996 $ 421,836 $ 509,788
Current ratio 1. 7 1.7 1.9
Inventory turnover (b) (c) 3.5 3.6 3.6
Bank borrowings to total capitalization 18.4% 7.4% 0.0%
Return on assets - continuing operations (b) (c) 10.6% 12.7% 13.5%
Return on shareholders' equity - continuing operations (b) (c) 22.8% 23.4% 22.8%
Cash Flow Data (b)
Cash provided by operating activities (d) $ 281,133 $ 318,471 $ 315,257
Cash used in investing activities (e) (130,357) (120,712) (114,552)
Cash flow (f) $ 150,776 $ 197,759 $ 200,705
Store Data
Stores open at end of the fiscal year 1,574 1,533 1,398
Gross square footage (000's) 47,376 45,780 42,037
Selling square footage (000's) 34,267 33,119 30,210
Increase in selling square footage 3.5% 9.6% 3.5%
Average selling square footage per store 21,771 21,604 21,609