Big Lots 2008 Annual Report Download - page 2
Download and view the complete annual report
Please find page 2 of the 2008 Big Lots annual report below. You can navigate through the pages in the report by either clicking on the pages listed below, or by using the keyword search tool below to find specific information within the annual report.-
 1
1 -
 2
2 -
 3
3 -
 4
4 -
 5
5 -
 6
6 -
 7
7 -
 8
8 -
 9
9 -
 10
10 -
 11
11 -
 12
12 -
 13
13 -
14
-
15
-
16
-
17
-
18
-
19
-
20
-
21
-
22
-
23
-
24
-
25
-
26
-
27
-
28
-
29
-
30
-
31
-
32
-
33
-
34
-
35
-
36
-
37
-
38
-
39
-
40
-
41
-
42
-
43
-
44
-
45
-
46
-
47
-
48
-
49
-
50
-
51
-
52
-
53
-
54
-
55
-
56
-
57
-
58
-
59
-
60
-
61
-
62
-
63
-
64
-
65
-
66
-
67
-
68
-
69
-
70
-
71
-
72
-
73
-
74
-
75
-
76
-
77
-
78
-
79
-
80
-
81
-
82
-
83
-
84
-
85
-
86
-
87
-
88
-
89
-
90
-
91
-
92
-
93
-
94
-
95
-
96
-
97
-
98
-
99
-
100
-
101
-
102
-
103
-
104
-
105
-
106
-
107
-
108
-
109
-
110
-
111
-
112
-
113
-
114
-
115
-
116
-
117
-
118
-
119
-
120
-
121
-
122
-
123
-
124
-
125
-
126
-
127
-
128
-
129
-
130
-
131
-
132
-
133
-
134
-
135
-
136
-
137
-
138
-
139
-
140
-
141
-
142
-
143
-
144
-
145
-
146
-
147
-
148
-
149
-
150
-
151
-
152
-
153
-
154
-
155
-
156
 |
 |

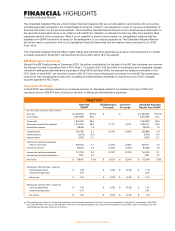
Earnings Data (a)
Net sales $ 4,645,283 $ 4,656,302 $ 4,743,048
Net sales (decrease) increase (0.2)% (1.8)% 7.1%
Income from continuing operations
(b)
$ 154,798 $ 145,079 $ 112,618
Income from continuing operations increase
(b)
6.7% 28.8% 616.2%
Earnings from continuing operations per share - diluted
(b)
$ 1.89 $ 1.41 $ 1.01
Earnings from continuing operations per share - diluted increase
(b)
34.0% 39.6% 621.4%
Average diluted common shares outstanding 82,076 102,542 111,930
Gross margin - % of net sales 40.0% 39.5% 39.9%
Selling and administrative expenses - % of net sales
(b)
32.8% 32.8% 34.2%
Depreciation expense - % of net sales 1.7% 1.9% 2.1%
Operating profit - % of net sales
(b)
5.5% 4.9% 3.5%
Net interest (income) expense - % of net sales 0.1% (0.1)% (0.1)%
Income from continuing operations - % of net sales
(b)
3.3% 3.1% 2.4%
Balance Sheet Data and Financial Ratios
Cash and cash equivalents $ 34,773 $ 37,131 $ 281,657
Inventories 736,616 747,942 758,185
Property and equipment - net 490,041 481,366 505,647
Total assets 1,432,458 1,443,815 1,720,526
Borrowings under bank credit facility 61,700 163,700 -
Shareholders’ equity 774,845 638,486 1,129,703
Working capital
(c)
$ 355,776 $ 390,766 $ 674,815
Current ratio 1.7 1.8 2.4
Inventory turnover
(a)
3.6 3.5 3.4
Bank borrowings to total capitalization 7.4% 20.4% 0.0%
Return on assets - continuing operations
(a)(b)
10.8% 9.2% 6.7%
Return on shareholders’ equity - continuing operations
(a)(b)
21.9% 16.4% 10.2%
Cash Flow Data (a)
Cash provided by operating activities
(d)
$ 211,063 $ 307,932 $ 381,477
Cash used in investing activities
(e)
(88,192) (58,764) (30,421)
Cash flow
(f)
$ 122,871 $ 249,168 $ 351,056
Store Data
Stores open at end of the fiscal year 1,339 1,353 1,375
Gross square footage (000’s) 39,888 40,195 40,770
Selling square footage (000’s) 28,674 28,902 29,376
Decrease in selling square footage (0.8)% (1.6)% (1.6)%
Average selling square footage per store 21,415 21,362 21,364
Other Sales Data
Comparable store sales growth 0.5% 2.0% 4.6%
Average sales per store
(a)
$ 3,416 $ 3,377 $ 3,377
Sales per selling square foot
(a)
$ 160 $ 158 $ 158
FINANCIAL HIGHLIGHTS
(Unaudited Adjusted Results)
(a) Fiscal 2006 was 53 weeks, while fiscal 2008 and fiscal 2007 were each 52 weeks.
(b) This item is shown excluding the impact of certain proceeds for fiscal 2007. A reconciliation of the difference between GAAP and the non-GAAP
financial measures presented in this table for fiscal 2007 is shown on the following page.
(c) Includes $61,700 in fiscal 2008 for current maturities of borrowings under our bank credit facility because the credit facility terminates in October 2009.
(d) Includes depreciation and amortization of $73,787, $83,103, and $95,613 for fiscal 2008, fiscal 2007, and fiscal 2006, respectively.
(e) Includes capital expenditures of $88,735, $60,360, and $35,878 for fiscal 2008, fiscal 2007, and fiscal 2006, respectively.
(f) Cash flow is calculated as cash provided by operating activities less cash used in investing activities.
Fiscal Year
($ in thousands, except per share amounts and
sales per selling square foot) 2008 2007 2006
Operating profit - % of net
sales (a)(b)
2006 2007 2008
8.0%
6.0%
4.0%
2.0%
0.0%
3.5%
4.9% 5.5%
2006 2007 2008
$2.40
$1.80
$1.20
$0.60
$0.00
Earnings from continuing
operations per share -
diluted (a)(b)
$1.89
$1.41
$1.01
2006 2007 2008
3.8
3.6
3.4
3.2
3.0
3.4
3.5
3.6
Inventory turnover (a)