Berkshire Hathaway 2007 Annual Report Download - page 60
Download and view the complete annual report
Please find page 60 of the 2007 Berkshire Hathaway annual report below. You can navigate through the pages in the report by either clicking on the pages listed below, or by using the keyword search tool below to find specific information within the annual report.-
 1
1 -
2
-
3
-
4
-
5
-
6
-
7
-
8
-
9
-
10
-
11
-
12
-
13
-
14
-
15
-
16
-
17
-
18
-
19
-
20
-
21
-
22
-
23
-
24
-
25
-
26
-
27
-
28
-
29
-
30
-
31
-
32
-
33
-
34
-
35
-
36
-
37
-
38
-
39
-
40
-
41
-
42
-
43
-
44
-
45
-
46
-
47
-
48
-
49
-
 50
50 -
 51
51 -
 52
52 -
 53
53 -
 54
54 -
 55
55 -
 56
56 -
 57
57 -
 58
58 -
 59
59 -
 60
60 -
 61
61 -
 62
62 -
 63
63 -
 64
64 -
 65
65 -
 66
66 -
 67
67 -
 68
68 -
 69
69 -
 70
70 -
71
-
72
-
73
-
74
-
75
-
76
-
77
-
78
 |
 |

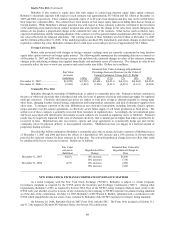
59
Finance and Financial Products
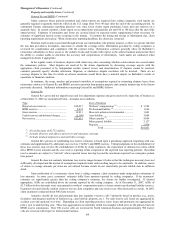
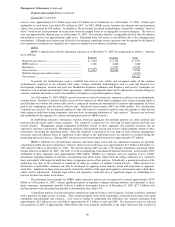
A summary of revenues and pre-tax earnings from Berkshire’ s finance and financial products businesses follows.
Amounts are in millions.
Revenues Earnings
2007 2006 2005 2007 2006 2005
Manufactured housing and finance............................. $3,665 $3,570 $3,175 $ 526 $ 513 $ 416
Furniture/transportation equipment leasing................ 810 880 856 111 182 173
Other........................................................................... 644 674 528 369 462 233
$5,119 $5,124 $4,559
Pre-tax earnings ............................................................. 1,006 1,157 822
Income taxes and minority interests.............................. 374 425 308
$ 632 $ 732 $ 514
Revenues from manufactured housing and finance activities (Clayton Homes) increased $95 million (3%) as compared
to 2006. In 2007, interest income from financing activities increased $70 million (7%) over 2006 reflecting higher average
installment loan balances. Installment loan balances outstanding as of December 31, 2007 were approximately $11.1 billion
compared to $9.9 billion and $9.5 billion at the end of 2006 and 2005. Pre-tax earnings of Clayton Homes increased $13 million
(3%) over 2006 reflecting a $30 million increase in net interest earned and lower credit losses partially offset by an overall 5%
decline in sales of manufactured homes. Installment loans originated or acquired by subsidiaries of Clayton Homes are financed
primarily with proceeds from debt issued by Berkshire Hathaway Finance Corporation (“BHFC”). In September 2007 and
January 2008, BHFC issued an aggregate of $2.75 billion par amount of new notes at interest rates that are on average
approximately 72 basis points higher than notes that matured in the second half of 2007 and January 2008. Accordingly, net
interest earned from financing activities may decline in 2008.
The increase in revenues in 2006 as compared to 2005 from Clayton Homes was primarily attributable to increased
sales of manufactured homes of $302 million due to increased sales of higher priced homes as well as an increase in total units
sold. Pre-tax earnings from Clayton Homes in 2006 increased $97 million (23%) as compared to 2005 which was due to
increased interest income from higher average installment loan balances as a result of loan portfolio acquisitions in 2005.
Revenues and pre-tax earnings from furniture/transportation equipment leasing activities for 2007 decreased $70
million (8%) and $71 million (39%), respectively, as compared to 2006. The declines primarily reflect lower rental income
driven by lower utilization rates for the over-the-road trailer and storage units. Due to significant cost components of this
business being fixed (depreciation and facility expenses), pre-tax earnings declined disproportionately to revenues.
Revenues of other finance business activities consist primarily of interest income earned on short-term and other fixed
maturity investments. Pre-tax earnings in 2007 reflected a charge of approximately $67 million from the adverse effects of
changes in mortality assumptions on certain life annuity contract liabilities. In 2006, pre-tax earnings included income of $67
million from an equity commitment fee and in 2005 pre-tax earnings included losses of $137 million from the General Re
derivatives business, which has now completed a major portion of its run-off, and Berkshire’ s investment in Value Capital, a
partnership interest that was liquidated as of June 30, 2006.
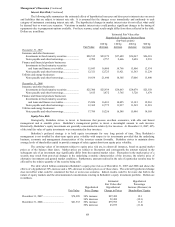
Investment and Derivative Gains/Losses
A summary of investment and derivative gains and losses follows. Amounts are in millions.
2007 2006 2005
Investment gains/losses from -
Sales and other disposals of investments -
Insurance and other ...................................................................................... $5,308 $1,782 $5,831
Finance and financial products .................................................................... 187 6 544
Other-than-temporary impairments.................................................................... — (142) (114)
Other .................................................................................................................. 103 165 (65)
5,598 1,811 6,196
Derivative gains/losses from -
Foreign currency forward contracts ................................................................... 62 186 (955)
Other derivative contracts .................................................................................. (151) 638 253
(89) 824 (702)
Gains/losses before income taxes and minority interests ........................................ 5,509 2,635 5,494
Income taxes and minority interests............................................................. 1,930 926 1,964
Net gains/losses....................................................................................................... $3,579 $1,709 $3,530
Investment gains or losses are recognized upon the sales of investments or as otherwise required under GAAP. The
timing of realized gains or losses from sales can have a material effect on periodic earnings. However, such gains or losses
usually have little, if any, impact on total shareholders’ equity because most equity and fixed maturity investments are carried at
fair value, with the unrealized gain or loss included as a component of other comprehensive income. Other-than-temporary
impairments represent the adjustment of cost to fair value when management concludes that an investment’ s decline in value
below cost is other than temporary. The impairment loss represents a non-cash charge to earnings.