Barnes and Noble 2015 Annual Report Download - page 8
Download and view the complete annual report
Please find page 8 of the 2015 Barnes and Noble annual report below. You can navigate through the pages in the report by either clicking on the pages listed below, or by using the keyword search tool below to find specific information within the annual report.-
 1
1 -
 2
2 -
 3
3 -
 4
4 -
 5
5 -
 6
6 -
 7
7 -
 8
8 -
 9
9 -
 10
10 -
 11
11 -
 12
12 -
 13
13 -
 14
14 -
 15
15 -
 16
16 -
 17
17 -
 18
18 -
 19
19 -
20
-
21
-
22
-
23
-
24
-
25
-
26
-
27
-
28
-
29
-
30
-
31
-
32
-
33
-
34
-
35
-
36
-
37
-
38
-
39
-
40
-
41
-
42
-
43
-
44
-
45
-
46
-
47
-
48
-
49
-
50
-
51
-
52
-
53
-
54
-
55
-
56
-
57
-
58
-
59
-
60
-
61
-
62
-
63
-
64
-
65
-
66
-
67
-
68
-
69
-
70
-
71
-
72
-
73
-
74
-
75
-
76
-
77
-
78
-
79
-
80
 |
 |

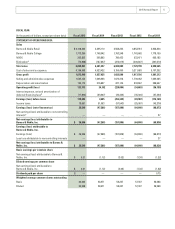
FISCAL YEAR
(In thousands of dollars, except per share data) Fiscal 2015 Fiscal 2014 Fiscal 2013 Fiscal 2012 Fiscal 2011
OTHER OPERATING DATA:
Number of stores
Barnes & Noble Retail 648 661 675 691 705
Barnes & Noble College 724 700 686 647 636
Total 1,372 1,361 1,361 1,338 1,341
Comparable sales increase (decrease)
Barnes & Noble Retaild(1.9)% (5.8)% (3.4)% 1.4% 0.7%
Barnes & Noble Retail Core comparable salese0.5% (3.1)% 0.1% 0.7% (8.3)%
Barnes & Noble Collegef0.1% (2.7)% (1.2)% (0.3)% (0.8)%
Capital expenditures $ 143,257 134,981 165,835 163,552 110,502
BALANCE SHEET DATA:
Total assets $ 3,229,505 3,537,449 3,732,536 3,774,699 3,596,466
Total liabilities $ 1,844,088 2,300,559 2,443,631 2,730,155 2,675,969
Long-term debt $ — — 77,000 324,200 313,100
Long-term subordinated noteg$ — — 127,250 150,000 150,000
Shareholders’ Equity $ 1,189,358 658,696 713,743 852,271 920,497
a Represents sales from NOOK to B&N Retail and B&N College on a sell-through basis.
b Amounts for fiscal 2015, fiscal 2014, fiscal 2013, fiscal 2012 and fiscal 2011 are net of interest income of $58, $190, $71, $0 and $320, respectively.
c Noncontrolling interest represents the 50% outside interest in Begin Smart LLC. During the second quarter of fiscal 2011, the Company purchased the
remaining 50% outside interest in Begin Smart LLC.
d Comparable store sales increase (decrease) is calculated on a 52-week basis, including sales from stores that have been open for at least 15 months
and all eReader device revenue deferred in accordance with Accounting Standards Codification 605-25 Revenue Recognition, Multiple Element
Arrangements, and does not include sales from closed or relocated stores.
e Core comparable store sales, which excludes sales of NOOK® products, increase (decrease) is calculated on a 52-week basis, including sales from
stores that have been open for at least 15 months and does not include sales from closed or relocated stores.
f Comparable store sales increase (decrease) is calculated on a 52-week basis, including sales from stores that have been open for at least 15 months
and does not include sales from closed stores for all periods presented. In fiscal 2012 through fiscal 2014, as the Company developed its textbook rental
business, comparable store sales reflected the retail selling price of a new or used textbook when rented, rather than solely the rental fees received,
to provide a more representative comparable store sales figure. Beginning with the 26 weeks ended November 1, 2014, as a result of the significant
expansion of the textbook rental business as compared to prior periods, the comparable store sales are determined based upon the actual revenue
received from textbook rentals and are no longer adjusted to reflect the equivalent textbook retail selling price.
g See Note 21 to the Notes to Consolidated Financial Statements.
6 Barnes & Noble, Inc. SELECTED CONSOLIDATED FINANCIAL DATA continued