Bank of Montreal 2008 Annual Report Download - page 7
Download and view the complete annual report
Please find page 7 of the 2008 Bank of Montreal annual report below. You can navigate through the pages in the report by either clicking on the pages listed below, or by using the keyword search tool below to find specific information within the annual report.-
 1
1 -
 2
2 -
 3
3 -
 4
4 -
 5
5 -
 6
6 -
 7
7 -
 8
8 -
 9
9 -
 10
10 -
 11
11 -
 12
12 -
 13
13 -
 14
14 -
 15
15 -
 16
16 -
 17
17 -
 18
18 -
19
-
20
-
21
-
22
-
23
-
24
-
25
-
26
-
27
-
28
-
29
-
30
-
31
-
32
-
33
-
34
-
35
-
36
-
37
-
38
-
39
-
40
-
41
-
42
-
43
-
44
-
45
-
46
-
47
-
48
-
49
-
50
-
51
-
52
-
53
-
54
-
55
-
56
-
57
-
58
-
59
-
60
-
61
-
62
-
63
-
64
-
65
-
66
-
67
-
68
-
69
-
70
-
71
-
72
-
73
-
74
-
75
-
76
-
77
-
78
-
79
-
80
-
81
-
82
-
83
-
84
-
85
-
86
-
87
-
88
-
89
-
90
-
91
-
92
-
93
-
94
-
95
-
96
-
97
-
98
-
99
-
100
-
101
-
102
-
103
-
104
-
105
-
106
-
107
-
108
-
109
-
110
-
111
-
112
-
113
-
114
-
115
-
116
-
117
-
118
-
119
-
120
-
121
-
122
-
123
-
124
-
125
-
126
-
127
-
128
-
129
-
130
-
131
-
132
-
133
-
134
-
135
-
136
-
137
-
138
-
139
-
140
-
141
-
142
-
143
-
144
-
145
-
146
-
147
-
148
-
149
-
150
-
151
-
152
-
153
-
154
-
155
-
156
-
157
-
158
-
159
-
160
-
161
-
162
 |
 |

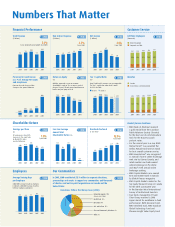
Full-Time Employees
(thousands)
Customer ServiceFinancial Performance
Numbers That Matter
Average Training Days
per Employee
(2004-2005 averages based on employee
headcount, 2006-2008 averages based on
full-time employee equivalent)
20082007200620052004
33.6 33.8 34.9 35.8 37.1
8.6 8.4 9.1 9.4
25.0 25.4 25.8
8.8
27.0 27.7
Operating groups
Corporate and T&O
20082007200620052004
1,174
186
1,180
212
1,182
219
1,224
247
1,280
297
977
Canada
United States and International
963
968
988 983
Total Revenue
($ billions)
Non-Interest Expense
($ billions)
Net Income
($ billions)
Provision for Credit Losses
as a % of Average Net Loans
and Acceptances
Provision for credit losses includes
changes in the general allowance.
i
P 38
i
P 42
i
P 34
i
P 20
i
P 41
i
P 35
i
P 60
i
P 34
i
P 33
i
P 62
i
P 20
i
P 22
20082007200620052004
9.3
9.8 10.0 10.2
9.3
2.6%
5-year compound annual growth rate (CAGR)
20082007200620052004
6.2 6.3 6.4 6.6 6.9
2.5%
5-year CAGR
20082007200620052004
2.3 2.4
2.7
2.1 2.0
2.1%
5-year CAGR
20082007200620052004
(0.07)
0.11 0.09
0.60
0.17
19.4 18.8 19.2
13.0
14.4
20082007200620052004
Tier 1 Capital Ratio
(%)
Basel I Basel II
20082007200620052004
9.84 10.30 10.22
9.51 9.77
Earnings per Share
($)
All earnings per share (EPS)
measures in this report refer
to diluted EPS, unless
specified otherwise.
Five-Year Average
Annual Total
Shareholder Return (%)
Dividends Declared
($ per share)
Shareholder Return
Employees Our Communities
20082007200620052004
4.40 4.63 5.15
3.76
4.11
1.8 %
5-year CAGR
20082007200620052004
18.9
13.8
19.1
14.2
0.9
20082007200620052004
1.59 1.85
2.26
2.71 2.80
15.9%
5-year CAGR
20082007200620052004
6.5 6.3 6.5 6.0
7.0
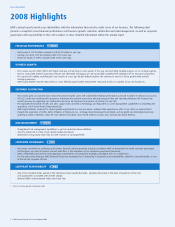
Product/Service Excellence
•BMO Bank of Montreal received
a gold medal from the Canadian
Public Relations Society (Toronto)
for the best use of communications
tools for the Business Coach
podcast series.
•For the second year in a row, BMO
Mutual Funds®was awarded the
Dalbar Mutual Fund Service Award
for best overall customer service.
•BMO InvestorLine®was recognized
as Canada’s fastest online brokerage
web site by Gómez Canada, and
rated number one bank-owned
online brokerage in The Globe
and Mail’s 10th annual online
brokerage ranking.
•BMO Capital Markets was named
Best Investment Bank in Canada
by Global Finance magazine.
•
BMO Capital Markets ranked as the
top Equity Research Group in Canada
for the 28th consecutive year
in the Brendan Wood International
Survey of Institutional Investors.
•Four funds managed by Private
Client Group received a 2008
Lipper Award for excellence in fund
performance: BMO Resource Fund,
BMO Dividend Fund, BMO Guardian
Global Technology Fund and
Phoenix Insight Value Equity Fund.
Branches
BMO has generated a return on common
shareholders’ equity of 13% or more in each of
the past 19 years, the only major North American
bank in our peer group to do so.
Basel I and Basel II measures are not comparable.
The Tier 1 capital ratio under Basel I would
be 9.41% for 2008.
Return on Equity
(%)
Donations: Where the Money Goes (2008)
Federated Appeals 10%
(includes United Way)
Health Care 33%
Education 31%
Arts and Culture 12%
Civic and Community Initiatives 9%
Other 5%
In 2008, BMO contributed $55.9 million in corporate donations,
sponsorships and events to support our communities and thousands
of charities and not-for-profit organizations in Canada and the
United States.