Banana Republic 2007 Annual Report Download - page 16
Download and view the complete annual report
Please find page 16 of the 2007 Banana Republic annual report below. You can navigate through the pages in the report by either clicking on the pages listed below, or by using the keyword search tool below to find specific information within the annual report.-
 1
1 -
2
-
3
-
4
-
5
-
 6
6 -
 7
7 -
 8
8 -
 9
9 -
 10
10 -
 11
11 -
 12
12 -
 13
13 -
 14
14 -
 15
15 -
 16
16 -
 17
17 -
 18
18 -
 19
19 -
 20
20 -
 21
21 -
 22
22 -
 23
23 -
 24
24 -
 25
25 -
 26
26 -
27
-
28
-
29
-
30
-
31
-
32
-
33
-
34
-
35
-
36
-
37
-
38
-
39
-
40
-
41
-
42
-
43
-
44
-
45
-
46
-
47
-
48
-
49
-
50
-
51
 |
 |

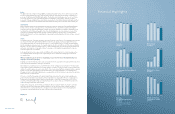
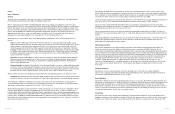
Total Return Analysis
2/1/2003 1/31/2004 1/29/2005 1/28/2006 2/3/2007 2/2/2008
The Gap, Inc. ............................... $100.00 $127.67 $151.87 $126.15 $135.94 $137.76
DJ US Retail, Apparel Index ................... $100.00 $132.87 $162.97 $183.18 $213.26 $166.87
S&P 500 Index .............................. $100.00 $134.54 $142.90 $157.71 $180.39 $176.07
Source: CTA Integrated Communications www.ctaintegrated.com (303) 665-4200. Data from ReutersBRIDGE
Data Networks.
Purchases of Equity Securities by the Issuer and Affiliated Purchasers
The following table presents information with respect to purchases of common stock of the Company made during
the thirteen weeks ended February 2, 2008, by The Gap, Inc. or any affiliated purchaser, as defined in Rule
10b-18(a)(3) under the Exchange Act.
Total
Number of
Shares
Purchased
Average
Price
Paid Per
Share
Total Number
of Shares
Purchased as
Part of Publicly
Announced
Plans or
Programs
Maximum Number
(or approximate
dollar amount) of
Shares that May
Yet be Purchased
Under the Plans or
Programs (1)
Month #1 (Nov. 4 – Dec. 1) ......................... 9,954,307 $19.15 9,954,307 $ 423 million
Month #2 (Dec. 2 – Jan. 5) ......................... 18,996,279 $20.82 18,996,279 $ 27 million
Month #3 (Jan. 6 – Feb. 2) ......................... 1,359,375 $19.96 1,359,375 $ —
Total ........................................... 30,309,961 30,309,961
(1) On August 21, 2007, our Board of Directors approved $1.5 billion for our share repurchase program, which
we announced on August 23, 2007. This authorization has been completed.
14Form10-K
Item 6. Selected Financial Data
The following selected financial data are derived from the Consolidated Financial Statements of the Company. We
have also included certain non-financial data to enhance your understanding of our business. In fiscal 2007, we
closed our Forth & Towne stores and, accordingly, the results of Forth & Towne have been presented as a
discontinued operation in the table below. The data set forth below should be read in conjunction with
“Management’s Discussion and Analysis of Financial Condition and Results of Operations” and the Company’s
Consolidated Financial Statements and notes herein.
Fiscal Year (number of weeks)
2007 (52) 2006 (53) 2005 (52) 2004 (52) 2003 (52)
Operating Results ($ in millions)
Net sales .................................. $ 15,763 $ 15,923 $ 16,019 $ 16,267 $ 15,854
Gross margin ............................... 36.1% 35.5% 36.7% 39.2% 37.6%
Operating margin (a) ......................... 8.3% 7.7% 11.1% 12.2% 11.9%
Earnings from continuing operations, net of income
taxes.................................... $ 867 $ 809 $ 1,131 $ 1,150 $ 1,031
Net earnings . . . . . . . . . . . . . . . . . . . . . . . . . . . . . . . $ 833 $ 778 $ 1,113 $ 1,150 $ 1,031
Cash dividends paid . . . . . . . . . . . . . . . . . . . . . . . . . $ 252 $ 265 $ 179 $ 79 $ 79
Per Share Data (number of shares in millions)
Earnings from continuing operations—basic ...... $ 1.10 $ 0.97 $ 1.28 $ 1.29 $ 1.15
Loss from discontinued operation—basic ........ $ (0.05) $ (0.03) $ (0.02) $ — $ —
Net earnings—basic ......................... $ 1.05 $ 0.94 $ 1.26 $ 1.29 $ 1.15
Earnings from continuing operations—diluted .... $ 1.09 $ 0.97 $ 1.26 $ 1.21 $ 1.09
Loss from discontinued operation—diluted ....... $ (0.04) $ (0.04) $ (0.02) $ — $ —
Net earnings—diluted ........................ $ 1.05 $ 0.93 $ 1.24 $ 1.21 $ 1.09
Weighted-average number of shares—basic . . . . . 791 831 881 893 893
Weighted-average number of shares—diluted . . . . 794 836 902 991 988
Cash dividend declared and paid (b) ............ $ 0.32 $ 0.32 $ 0.18 $ 0.09 $ 0.09
Financial Position ($ in millions except
inventory per square foot)
Merchandise inventory ....................... $ 1,575 $ 1,796 $ 1,696 $ 1,814 $ 1,704
Total assets ................................ $ 7,838 $ 8,544 $ 8,821 $ 10,048 $ 10,713
Inventory per square foot (c) . . . . . . . . . . . . . . . . . . $ 37 $ 44 $ 43 $ 48 $ 45
Percentage increase (decrease) in inventory per
square foot ............................... (15.3)% 2.4% (10.7)% 6.2% (15.5)%
Working capital ............................. $ 1,653 $ 2,757 $ 3,297 $ 4,062 $ 4,156
Total long-term debt and senior convertible notes,
less current maturities (d) . . . . . . . . . . . . . . . . . . . $ 50 $ 188 $ 513 $ 1,886 $ 2,487
Stockholders’ equity ......................... $ 4,274 $ 5,174 $ 5,425 $ 4,936 $ 4,648
Other Data ($ and square footage in millions)
Purchase of property and equipment . . . . . . . . . . . . $ 682 $ 572 $ 600 $ 419 $ 261
Number of new store locations opened . . . . . . . . . . 214 194 198 130 35
Number of store locations closed . . . . . . . . . . . . . . . 178 116 139 158 130
Number of store locations open at year-end ...... 3,167 3,131 3,053 2,994 3,022
Percentage increase (decrease) in comparable
store sales (52-week basis) ................. (4)% (7)% (5)% 0% 7%
Square footage of store space at year-end ....... 39.6 38.9 37.8 36.6 36.5
Percentage increase (decrease) in square feet . . . 1.8% 2.9% 3.3% 0.3% (2.1)%
Number of employees at year-end .............. 150,000 154,000 153,000 152,000 153,000
Form10-K1514Form10-K