BMW 2009 Annual Report Download - page 33
Download and view the complete annual report
Please find page 33 of the 2009 BMW annual report below. You can navigate through the pages in the report by either clicking on the pages listed below, or by using the keyword search tool below to find specific information within the annual report.-
 1
1 -
2
-
3
-
4
-
5
-
6
-
7
-
8
-
9
-
10
-
11
-
12
-
13
-
14
-
15
-
16
-
17
-
18
-
19
-
20
-
21
-
22
-
 23
23 -
 24
24 -
 25
25 -
 26
26 -
 27
27 -
 28
28 -
 29
29 -
 30
30 -
 31
31 -
 32
32 -
 33
33 -
 34
34 -
 35
35 -
 36
36 -
 37
37 -
 38
38 -
 39
39 -
 40
40 -
 41
41 -
 42
42 -
 43
43 -
44
-
45
-
46
-
47
-
48
-
49
-
50
-
51
-
52
-
53
-
54
-
55
-
56
-
57
-
58
-
59
-
60
-
61
-
62
-
63
-
64
-
65
-
66
-
67
-
68
-
69
-
70
-
71
-
72
-
73
-
74
-
75
-
76
-
77
-
78
-
79
-
80
-
81
-
82
-
83
-
84
-
85
-
86
-
87
-
88
-
89
-
90
-
91
-
92
-
93
-
94
-
95
-
96
-
97
-
98
-
99
-
100
-
101
-
102
-
103
-
104
-
105
-
106
-
107
-
108
-
109
-
110
-
111
-
112
-
113
-
114
-
115
-
116
-
117
-
118
-
119
-
120
-
121
-
122
-
123
-
124
-
125
-
126
-
127
-
128
-
129
-
130
-
131
-
132
-
133
-
134
-
135
-
136
-
137
-
138
-
139
-
140
-
141
-
142
-
143
-
144
-
145
-
146
-
147
-
148
-
149
-
150
-
151
-
152
-
153
-
154
-
155
-
156
-
157
-
158
-
159
-
160
-
161
-
162
-
163
-
164
-
165
-
166
-
167
-
168
-
169
-
170
-
171
-
172
-
173
-
174
-
175
-
176
-
177
-
178
-
179
-
180
-
181
-
182
-
183
-
184
-
185
-
186
-
187
-
188
-
189
-
190
-
191
-
192
-
193
-
194
-
195
-
196
-
197
-
198
-
199
-
200
-
201
-
202
-
203
-
204
-
205
-
206
-
207
-
208
-
209
-
210
-
211
-
212
-
213
-
214
-
215
-
216
-
217
-
218
-
219
-
220
-
221
-
222
-
223
-
224
-
225
-
226
-
227
-
228
-
229
-
230
-
231
-
232
-
233
-
234
-
235
-
236
-
237
-
238
-
239
-
240
-
241
-
242
-
243
-
244
-
245
-
246
-
247
-
248
-
249
-
250
-
251
-
252
-
253
-
254
 |
 |

31 Group Management Report
Further progress made with sustainability strategy
During the first half of 2009 we made further progress in
developing our sustainability strategy. The Group’s sustain-
ability strategy is directly derived from the Strategy Number
ONE and applies across all board divisions worldwide.
The primary objective is to instil sustainability in each and
every link of the value-added chain and its underlying
processes. In order to implement this sustainability strategy
we have established a set of core principles and defined
fields of action. These include the continued expansion of
our efficient drive train technologies and the implementa-
tion of concepts for sustainable mobility in metropolitan
areas. At production level, we will continue to cut down on
the volume of resources used and reduce the impact that
production processes have on the environment. As an
attractive employer, we want to motivate and increase the
sense of satisfaction felt by our employees, while at the
same time preparing our specialists and managers for
future challenges. We are also endeavouring to embed our
ecological and social requirements at all points along the
supply chain. As an integral part of society, we are com-
mitted
to solving challenging social issues with the ulti-
mate aim of making a proactive contribution towards
shap-
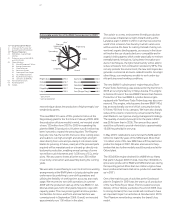
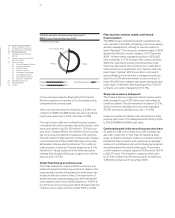
ing the overall conditions under which we operate. Using
a so-called “environmental radar” that includes ecological
and social criteria, engaging in dialogue with stakeholders,
taking sustainability into account in all decisions and keep-
ing a tight watch over the whole of the value-added chain
are key elements of sustainability management.
Corporate sustainability measured in balanced scorecard
terms (at Group level) was first included as a formal corpo-
rate objective at the beginning of 2009. Detailed targets
are then derived for each of the divisions within the Group.
Nowadays, every project must be measured in terms of
corporate sustainability. This involves measuring the
con-
sumption of resources and emission levels as well as the
social and socio-political consequences of the various so-
lutions at hand. As part of the process of improving the way
in which we measure and manage our corporate sustain-
ability activities and taking account more of strategic im-
pulses, we continued to expand our sustainability organisa-
tion in 2009. The newly established Sustainability Circle,
consisting of one representative from each division, is re-
sponsible for implementing sustainability activities across
the Group. The Circle is headed by the Group Repre-
sentative
for Sustainability and Environmental Protection.
The Sustainability Board, composed of the entire Board
of
Management, was set up in summer 2009 and is re-
sponsible for setting the strategic course with respect to
corporate sustainability.
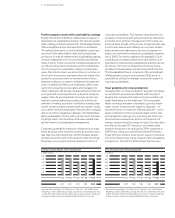
Clear guidelines for clean production
In keeping with our “clean production” approach, we design
our production processes worldwide with the goal of
keeping the environmental impact as low as possible and
totally eliminating it in the ideal case. The measurable
values of energy and water consumption, process waste-
water, solvent emissions and waste for disposal – ex-
pressed
in terms of “waste per vehicle produced” – are in-
tegral components of the groupwide target system and
are managed accordingly. CO2 emissions per vehicle
pro-
duced are also measured as a factor of the amount of
energy consumed and the energy mix used. Our objectives
are clear: by the year 2012 resource consumption and
emission levels are to be reduced by 30 % compared to
2006 levels. Using a so-called Environmental Efficiency
Figure (EEF) as indicator, reductions in resource consump-
tion and emission levels will be measured from all available
perspectives. The
EEF
for 2009 shows that resource
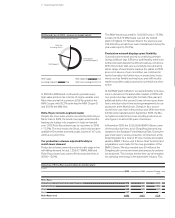
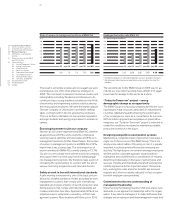
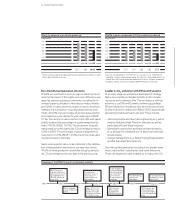
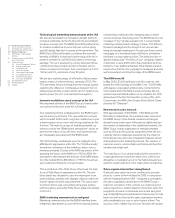
Energy consumed per vehicle produced
in MWh / vehicle
3.00
2.90
2.80
2.70
2.60
2.50
05 06 07
* 08 09
2.94 2.90 2.78 2.80 2.89
*
Basis for data expanded in 2007 from ten to 17 locations. Until 2006: Munich,
Dingolfing, Landshut, Regensburg, Leipzig, Steyr, Rosslyn, Spartanburg, Hams Hall,
Oxford. Since 2007:
Berlin (brake disc production), Eisenach, Swindon, Goodwood,
Rayong (assembly), Chennai
(assembly) and BMW Brilliance in Shenyang.
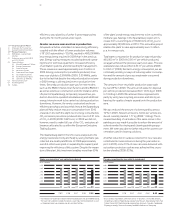
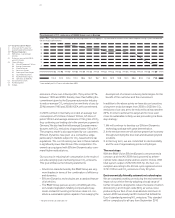
CO2 emissions per vehicle produced
in t / vehicle
1.00
0.95
0.90
0.85
0.80
0.75
05 06 07
* 08 09
0.99 0.94 0.84 0.82 0.91
* B
asis for data expanded in 2007 from ten to 17 locations. Until 2006: Munich,
Dingolfing, Landshut, Regensburg, Leipzig, Steyr, Rosslyn, Spartanburg, Hams Hall,
Oxford. Since 2007:
Berlin (brake disc production), Eisenach, Swindon, Goodwood,
Rayong (assembly), Chennai
(assembly) and BMW Brilliance in Shenyang.