BMW 2007 Annual Report Download - page 79
Download and view the complete annual report
Please find page 79 of the 2007 BMW annual report below. You can navigate through the pages in the report by either clicking on the pages listed below, or by using the keyword search tool below to find specific information within the annual report.-
 1
1 -
2
-
3
-
4
-
5
-
6
-
7
-
8
-
9
-
10
-
11
-
12
-
13
-
14
-
15
-
16
-
17
-
18
-
19
-
20
-
21
-
22
-
23
-
24
-
25
-
26
-
27
-
28
-
29
-
30
-
31
-
32
-
33
-
34
-
35
-
36
-
37
-
38
-
39
-
40
-
41
-
42
-
43
-
44
-
45
-
46
-
47
-
48
-
49
-
50
-
51
-
52
-
53
-
54
-
55
-
56
-
57
-
58
-
59
-
60
-
61
-
62
-
63
-
64
-
65
-
66
-
67
-
68
-
 69
69 -
 70
70 -
 71
71 -
 72
72 -
 73
73 -
 74
74 -
 75
75 -
 76
76 -
 77
77 -
 78
78 -
 79
79 -
 80
80 -
 81
81 -
 82
82 -
 83
83 -
 84
84 -
 85
85 -
 86
86 -
 87
87 -
 88
88 -
 89
89 -
90
-
91
-
92
-
93
-
94
-
95
-
96
-
97
-
98
-
99
-
100
-
101
-
102
-
103
-
104
-
105
-
106
-
107
-
108
-
109
-
110
-
111
-
112
-
113
-
114
-
115
-
116
-
117
-
118
-
119
-
120
-
121
-
122
-
123
-
124
-
125
-
126
-
127
-
128
-
129
-
130
-
131
-
132
-
133
-
134
-
135
-
136
-
137
-
138
-
139
-
140
-
141
-
142
-
143
-
144
-
145
-
146
-
147
-
148
-
149
-
150
-
151
-
152
-
153
-
154
-
155
-
156
-
157
-
158
-
159
-
160
-
161
-
162
-
163
-
164
-
165
-
166
-
167
-
168
-
169
-
170
-
171
-
172
-
173
-
174
-
175
-
176
-
177
-
178
-
179
-
180
-
181
-
182
-
183
-
184
-
185
-
186
-
187
-
188
-
189
-
190
-
191
-
192
-
193
-
194
-
195
-
196
-
197
-
198
-
199
-
200
-
201
-
202
-
203
-
204
-
205
-
206
-
207
-
208
-
209
-
210
-
211
-
212
-
213
-
214
-
215
-
216
-
217
-
218
-
219
-
220
-
221
-
222
-
223
-
224
-
225
-
226
-
227
-
228
-
229
-
230
-
231
-
232
-
233
-
234
-
235
-
236
-
237
-
238
-
239
-
240
-
241
-
242
-
243
-
244
-
245
-
246
-
247
 |
 |

77
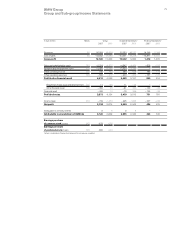
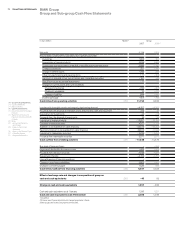
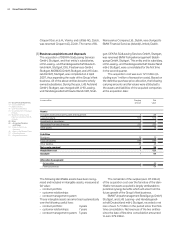
Industrial Operations1] Financial Operations1]
2007 20062] 2007 20062]
2,963 2,449 424 535 Net profit
Reconciliation of net profit to cash inflow from operating activities
948 938 54 55 Current tax
4 4 4,324 3,560 Depreciation of leased products
3,665 3,315 24 25 Depreciation and amortisation of tangible, intangible and investment assets
398 – 220 – 143 – 130 Change in provisions
– 472 77 300 227 Change in deferred taxes
146 – 436 – 35 107 Other non-cash income and expense items
– 180 – 70 – 1 2 Gain/loss on disposal of non-current assets and marketable securities
– 11 25 – – Result from equity accounted investments
Changes in current assets and current liabilities
– 703 – 261 3 – 4 Change in inventories
– 98 – 493 – 112 – 135 Change in receivables
368 658 745 485 Change in liabilities
– 688 – 613 – 129 – 120 Income taxes paid
6,340 5,373 5,454 4,607 Cash inflow from operating activities
– 4,156 – 4,272 – 111 – 41 Investment in intangible assets and property, plant and equipment
270 31 2 8 Proceeds from the disposal of intangible assets and property, plant and equipment
– 44 – 24 – – 5 Expenditure for investments
16 76 – 34 Proceeds from the disposal of investments
– 359 – 392 – 12,902 – 10,362 Investment in leased products
354 364 4,563 3,355 Disposals of leased products
– – – 54,573 – 50,313 Additions to receivables from sales financing
– – 49,813 47,848 Payments received on receivables from sales financing
– 2,698 – 2,619 – – 35 Investment in marketable securities
2,568 2,419 9 258 Proceeds from marketable securities
– 4,049 – 4,417 – 13,199 – 9,253 Cash outflow from investing activities
– – 253 – – Buy-back of treasury shares
– 458 – 419 – – Payment of dividend for the previous year
– 1 6,038 6,875 Proceeds from the issue of bonds
– – 1 – 4,152 – 4,490 Repayment of bonds
– 1,634 – 1,040 1,634 1,040 Internal financing of financial operations
– 377 – 129 3,980 1,156 Change in other financial liabilities
845 644 681 – 61 Change in commercial paper
– 1,624 – 1,197 8,181 4,520 Cash inflow/outflow from financing activities
Effect of exchange rate and changes in composition of group on
– 15 104 – 31 – 22 cash and cash equivalents
652 – 137 405 – 148 Change in cash and cash equivalents
1,235 1,372 101 249 Cash and cash equivalents as at 1 January
1,887 1,235 506 101 Cash and cash equivalents as at 31 December