BMW 2001 Annual Report Download - page 73
Download and view the complete annual report
Please find page 73 of the 2001 BMW annual report below. You can navigate through the pages in the report by either clicking on the pages listed below, or by using the keyword search tool below to find specific information within the annual report.
001 BMW Group in figures
004 Report of the Supervisory Board
008 Supervisory Board
011 Board of Management
012 Group Management Report
029 BMW Stock
033 Group Financial Statements
098 BMW AG Financial Statements
104 BMW Group Annual Comparison
106 BMW Group Locations
108 Glossary
112 Index
72
A break-down of the different classes of financial as-
sets disclosed in the balance sheet and changes
during the year are shown in the analysis of changes
in Group non-current assets on pages 48 and 49.
Additions to investments in subsidiaries result
partly from the incorporation of new companies,
namely Alphabet Fuhrparkmanagement (Schweiz)
AG, Ötelfingen, BMW Denmark Holding A/S, Kold-
ing, PT BMW Indonesia, Jakarta and BMW Philip-
pines Corp., Manila. In addition, share capital in-
creases were made in BMW Financial Services
Scandinavia AB, Solna, BMW Russia Trading OOO,
Moscow, BMW (Thailand) Co. Ltd., Bangkok, Alpha-
bet Italia S.p.A., Milan and BMW Renting (Portugal)
Lda., Lisbon.
Disposals of investments in subsidiaries result
primarily from the initial consolidation of Hireus Ltd.,
The BMW Group, as lessor, leases out assets (pre-
dominantly own products) as part of sales financing.
Minimum lease payments of euro 3,736 million
Contingent rents of euro 15 million (2000: euro
8 million), based principally on the distance driven,
were recognised in income.
Changes in the estimated residual values of
leased products had an impact on the result in the
year of euro 65 million (2000: euro 269 million).
Bracknell, and from the disposal of other companies
not previously consolidated.
Investments in associated companies comprise
primarily the Groups interest in Rover Finance Hold-
ings Ltd., Guildford and in the joint venture TRITEC
Motors Ltda., Campo Largo, consolidated using the
equity method. The assets and liabilities as well as
income and expense items of the joint venture
TRITEC Motors Ltda., Campo Largo, are not materi-
al to the respective positions in the BMW Group fi-
nancial statements.
The changes in investments in other compa-
nies result partly from different fair values at the two
reporting dates and partly from the conversion of
dividend rights into additional shares in Rolls-Royce
plc, London.
(2000: euro 3,437 million) from non-cancellable op-
erating leases fall due as follows:
Changes in leased products during the year
are shown in the analysis of changes in Group non-
current assets on pages 48 and 49.
[19]Financial assets
[20]Leased products
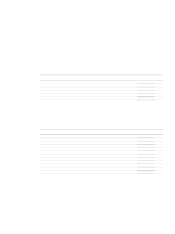
in euro million 31.12. 2001 31.12.2000
within one year 2,076 1,823
between one and five years 1,640 1,608
later than five years 20 6
3,736 3,437


