Autodesk 2000 Annual Report Download - page 2
Download and view the complete annual report
Please find page 2 of the 2000 Autodesk annual report below. You can navigate through the pages in the report by either clicking on the pages listed below, or by using the keyword search tool below to find specific information within the annual report.-
 1
1 -
 2
2 -
 3
3 -
 4
4 -
 5
5 -
 6
6 -
 7
7 -
 8
8 -
 9
9 -
 10
10 -
 11
11 -
 12
12 -
 13
13 -
14
-
15
-
16
-
17
-
18
-
19
-
20
-
21
-
22
-
23
-
24
-
25
-
26
-
27
-
28
-
29
-
30
-
31
-
32
-
33
-
34
-
35
-
36
-
37
-
38
-
39
-
40
-
41
-
42
-
43
-
44
-
45
-
46
-
47
-
48
-
49
-
50
-
51
-
52
-
53
-
54
-
55
-
56
-
57
-
58
 |
 |

1
Autodesk, Inc. FY 00
Letter to Stockholders:
Let me begin by thanking you, as well as our employees, partners, and cus-
tomers, for your continued support through an unexpectedly difficult year.
I believe your confidence in Autodesk is justified.
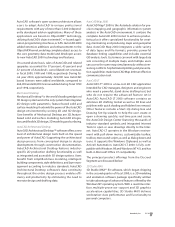
The year’s mixed financial results were disappointing. But we know
what caused the problems, and we’ve worked through them and moved
our business beyond them.
Most important, we worked hard and smart all year to firmly position
the company for a robust future. Not only did we deliver the richest
product suite in the design and entertainment industries, but we also
hammered out,and began executing,strategic initiatives that leverage our
unique and formidable assets as we lead design to the Internet.
Before I discuss our strategic achievements and what they mean for our
future, let’s take a detailed look at the financial challenges we faced—
beginning with the overall revenue picture.
The Overall Revenue Picture
Overall fiscal year 2000 (FY00) revenues were $820 million, down 6 percent from the previous year. Here’s how
the year’s revenues looked by business segment and by region.
Business Segment
• Design Solutions revenues fell by 7 percent to $648 million.
• Discreet revenues equaled the previous year’s $172 million.
Regions
• Americas revenues fell 15 percent to $353 million.
• Europe, Middle East, and Africa (EMEA) revenues fell 10 percent to $296 million.
• Asia Pacific revenues grew 32 percent to $171 million.
Now let’s review the challenges that contributed to this revenue picture.