Audiovox 1998 Annual Report Download - page 17
Download and view the complete annual report
Please find page 17 of the 1998 Audiovox annual report below. You can navigate through the pages in the report by either clicking on the pages listed below, or by using the keyword search tool below to find specific information within the annual report.-
 1
1 -
2
-
3
-
4
-
5
-
6
-
 7
7 -
 8
8 -
 9
9 -
 10
10 -
 11
11 -
 12
12 -
 13
13 -
 14
14 -
 15
15 -
 16
16 -
 17
17 -
 18
18 -
 19
19 -
 20
20 -
 21
21 -
 22
22 -
 23
23 -
 24
24 -
 25
25 -
 26
26 -
 27
27 -
28
-
29
-
30
-
31
-
32
-
33
-
34
-
35
-
36
-
37
-
38
-
39
-
40
-
41
-
42
-
43
-
44
 |
 |

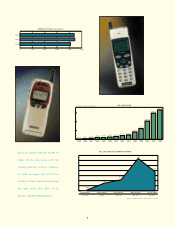
The following table sets forth for the periods indicated
certain statements of income data for the Communications
group expressed as a percentage of net sales:
COMMUNICATIONS
1998 1997
Net sales:
Cellular product—
wholesale.............. $398,113 90.1% $390,230 87.8%
Cellular product—
retail...................... 4,493 1.0 6,280 1.4
Activation
commissions......... 22,785 5.1 31,061 7.0
Residual fees............ 4,452 1.0 4,688 1.1
Other ........................ 11,747 2.7 12,141 2.7
Total net sales ...... 441,590 100.0 444,400 100.0
Gross profit .................. 52,270 11.8 66,117 14.9
Total operating
expenses .................. 48,257 10.9 49,582 11.2
Operating income ....... 4,013 0.9 16,535 3.7
Other expense............. (5,799) (1.3) (4,953) (1.1)
Pre-tax income (loss) ... $ (1,786) (0.4)% $ 11,582 2.6%
Automotive Results
Net sales decreased approximately $18,805 from 1997, a
decrease of 9.7%. This decrease was primarily from a $21.3
million decrease in net sales in the Company’s foreign sub-
sidiaries, primarily Malaysia, composed chiefly of security
and accessory products. Domestic operation sales of
Automotive sound, security, accessories and consumer
goods products increased approximately $4.7 million, or
3.7%, from 1997. The main components of this increase
being the mobile video and leisure products categories. The
domestic operations sales grew by $7.3 million, or 5.9%,
before the Heavy Duty Sound division was transferred to
one of the Company’s equity investments during 1997.
Operating expenses decreased 3.1% from 1997 to
$27,126, primarily in our international operations. This was
partially offset by an increase in domestic operating
expenses. Selling expenses decreased during 1998, primar-
ily in commissions and salaries in our foreign companies and
market development funds and co-operative advertising in
our domestic operations. This was partially offset by
increases in domestic commissions and trade show
expenses. General and administrative expenses decreased
from 1997, mostly in foreign office expenses, bad debt
expense and executive salaries, both domestic and foreign.
These decreases were partially offset by increases in office
salaries, domestically, and professional fees, both domestic
and foreign. Warehousing and assembly expenses increased
from 1997, primarily in field warehousing and direct labor.
Pre-tax income decreased $2,065 from last year, primarily
due to a decrease of $2.6 million from foreign operations,
partially offset by an increase in pre-tax income from domes-
tic operations.
The Company believes that the Automotive group has an
expanding market with a certain level of volatility related to
both domestic and international new car sales. Also, certain
of its products are subject to price fluctuations which could
affect the carrying value of inventories and gross margins in
the future.
The following table sets forth for the periods indicated
certain statements of income data for the Automotive group
expressed as a percentage of net sales:
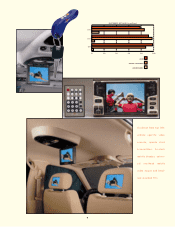
AUTOMOTIVE
1998 1997
Net sales:
Sound ....................... $ 78,338 44.8% $ 91,763 47.3%
Security and
accessories ........... 84,973 48.5 97,446 50.3
Consumer goods..... 11,794 6.7 4,701 2.4
Total net sales ...... 175,105 100.0 193,910 100.0
Gross profit .................. 36,433 20.8 40,326 20.8
Total operating
expenses .................. 27,126 15.5 27,989 14.4
Operating income ....... 9,307 5.3 12,337 6.4
Other expense............. (3,370) (1.9) (4,335) (2.2)
Pre-tax income............. $ 5,937 3.4% $ 8,002 4.1%
Other Income and Expense
Interest expense and bank charges increased $2,227 dur-
ing 1998 from 1997. This increase was primarily due to an
increase in average outstanding interest bearing debt.
Another major factor was the increase in interest rates expe-
rienced by the Company’s subsidiary in Venezuela. The
increase in the rate, coupled with the additional outstanding
debt as a result of the growth of that operation, resulted in
an increase in Venezuelan interest expense of $975.
15