Atmos Energy 1997 Annual Report Download - page 4
Download and view the complete annual report
Please find page 4 of the 1997 Atmos Energy annual report below. You can navigate through the pages in the report by either clicking on the pages listed below, or by using the keyword search tool below to find specific information within the annual report.-
 1
1 -
 2
2 -
 3
3 -
 4
4 -
 5
5 -
 6
6 -
 7
7 -
 8
8 -
 9
9 -
 10
10 -
 11
11 -
 12
12 -
 13
13 -
 14
14 -
 15
15 -
16
-
17
-
18
-
19
-
20
-
21
-
22
-
23
-
24
-
25
-
26
-
27
-
28
-
29
-
30
-
31
-
32
-
33
-
34
-
35
-
36
-
37
-
38
-
39
-
40
-
41
-
42
-
43
-
44
-
45
-
46
-
47
-
48
-
49
-
50
-
51
-
52
-
53
 |
 |

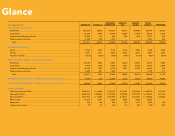
WESTERN GREELEY UNITED TOTAL
As of September 30, 1997 ENERGAS TRANS LA KENTUCKY GAS CITIES UTILITY PROPANE
___________________________________________________ ___________________________________________________ ___________________________________________________ ___________________________________________________ ___________________________________________________ ___________________________________________________ ____________________________________________________
CUSTOMERS, at end of year
Residential.......................................................................................................................... 268,518 73,546 154,219 99,472 274,992 870,474 23,278
Commercial ........................................................................................................................ 25,234 5,409 17,706 13,328 31,026 92,703 4,073
Industrial (including agricultural) ....................................................................................... 15,589 120 460 385 663 17,217 873
Public authority and other................................................................................................. 2,230 978 1,573 - - 4,781 873
___________________________________________________ ___________________________________________________ ___________________________________________________ ___________________________________________________ ___________________________________________________ ___________________________________________________ ____________________________________________________
Total................................................................................................................................ 311,571 80,053 173,958 113,185 306,681 985,448 29,097
___________________________________________________ ___________________________________________________ ___________________________________________________ ___________________________________________________ ___________________________________________________ ___________________________________________________ ____________________________________________________
___________________________________________________ ___________________________________________________ ___________________________________________________ ___________________________________________________ ___________________________________________________ ___________________________________________________ ____________________________________________________
HEATING DEGREE DAYS
Actual ................................................................................................................................. 3,553 1,523 4,178 6,195 3,980 3,909 3,930
Normal ............................................................................................................................... 3,531 1,771 4,333 6,274 4,070 3,990 4,229
Percent of normal .............................................................................................................. 100.6% 86.0% 96.4% 98.7% 97.8% 98.0% 92.9%
SALES VOLUMES – MMcf, except propane in gallons
Residential.......................................................................................................................... 24,292 3,558 13,543 10,227 23,595 75,215 11,598
Commercial ........................................................................................................................ 7,912 1,383 6,070 6,731 15,286 37,382 3,958
Industrial (including agricultural) ....................................................................................... 19,084 1,872 6,128 1,907 17,425 46,416 872
Public authority and other................................................................................................. 2,689 951 1,555 - - 5,195 717
___________________________________________________ ___________________________________________________ ___________________________________________________ ___________________________________________________ ___________________________________________________ ___________________________________________________ ____________________________________________________
Total................................................................................................................................ 53,977 7,764 27,296 18,865 56,306 164,208 17,145
TRANSPORTATION VOLUMES – MMcf, except propane in gallons ............................... 4,479 624 22,398 3,275 18,024 48,800 15,830
___________________________________________________ ___________________________________________________ ___________________________________________________ ___________________________________________________ ___________________________________________________ ___________________________________________________ ____________________________________________________
TOTAL VOLUMES DELIVERED – MMcf, except propane in gallons ............................... 58,456 8,388 49,694 22,140 74,330 213,008 32,975
___________________________________________________ ___________________________________________________ ___________________________________________________ ___________________________________________________ ___________________________________________________ ___________________________________________________ ____________________________________________________
___________________________________________________ ___________________________________________________ ___________________________________________________ ___________________________________________________ ___________________________________________________ ___________________________________________________ ____________________________________________________
OTHER STATISTICS
Operating revenues (000’s) ............................................................................................... $234,310 $ 51,866 $144,139 $ 91,341 $343,064 $ 864,720 $33,194
Gross plant (000’s) ............................................................................................................. $252,002 $108,822 $175,793 $137,489 $501,972 $1,176,078 $31,728
Net plant (000’s) ................................................................................................................ $153,977 $ 78,354 $105,393 $ 83,371 $314,591 $ 735,686 $19,526
Miles of pipe ...................................................................................................................... 13,214 2,241 3,638 3,864 7,945 30,902 -
Employees.......................................................................................................................... 534 154 330 250 1,031 2,299 162
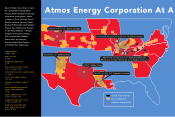
Communities served.......................................................................................................... 92 41 163 123 383 802 240
gy Corporation At A Glance