Asus 2012 Annual Report Download - page 64
Download and view the complete annual report
Please find page 64 of the 2012 Asus annual report below. You can navigate through the pages in the report by either clicking on the pages listed below, or by using the keyword search tool below to find specific information within the annual report.-
 1
1 -
2
-
3
-
4
-
5
-
6
-
7
-
8
-
9
-
10
-
11
-
12
-
13
-
14
-
15
-
16
-
17
-
18
-
19
-
20
-
21
-
22
-
23
-
24
-
25
-
26
-
27
-
28
-
29
-
30
-
31
-
32
-
33
-
34
-
35
-
36
-
37
-
38
-
39
-
40
-
41
-
42
-
43
-
44
-
45
-
46
-
47
-
48
-
49
-
50
-
51
-
52
-
53
-
 54
54 -
 55
55 -
 56
56 -
 57
57 -
 58
58 -
 59
59 -
 60
60 -
 61
61 -
 62
62 -
 63
63 -
 64
64 -
 65
65 -
 66
66 -
 67
67 -
 68
68 -
 69
69 -
 70
70 -
 71
71 -
 72
72 -
 73
73 -
 74
74 -
75
-
76
-
77
-
78
-
79
-
80
-
81
-
82
-
83
-
84
-
85
-
86
-
87
-
88
-
89
-
90
-
91
-
92
-
93
-
94
-
95
-
96
-
97
-
98
-
99
-
100
-
101
-
102
-
103
-
104
-
105
-
106
-
107
-
108
-
109
-
110
-
111
-
112
-
113
-
114
-
115
-
116
-
117
-
118
-
119
-
120
-
121
-
122
-
123
-
124
-
125
-
126
-
127
-
128
-
129
-
130
-
131
-
132
-
133
-
134
-
135
-
136
-
137
-
138
-
139
-
140
-
141
-
142
-
143
-
144
-
145
-
146
-
147
-
148
-
149
-
150
-
151
-
152
-
153
-
154
-
155
-
156
-
157
-
158
-
159
-
160
-
161
-
162
-
163
-
164
-
165
-
166
-
167
-
168
-
169
-
170
-
171
-
172
-
173
-
174
-
175
-
176
-
177
-
178
-
179
-
180
-
181
-
182
-
183
-
184
-
185
-
186
-
187
-
188
-
189
-
190
-
191
-
192
-
193
-
194
-
195
-
196
-
197
-
198
-
199
-
200
-
201
-
202
-
203
-
204
-
205
-
206
-
207
-
208
-
209
-
210
-
211
-
212
-
213
-
214
-
215
-
216
-
217
-
218
-
219
-
220
-
221
 |
 |

60
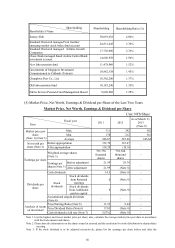
Shareholding
Shareholder’s Name
Shareholding Shareholding Ratio (%)
Jonney Shih 30,093,638 4.00%
Standard Chartered managed Van Gardner
emerging market stock index fund account 24,831,445 3.30%
Standard Chartered managed Infinite Growth
Companies 17,730,000 2.36%
Chase Bank managed Saudi Arabia Central Bank
investment account 14,640,958 1.94%
New labor pension fund 11,478,980 1.52%
Governemnt of Singapore Investment
Commissioned to Citibank (Taiwan) 10,882,358 1.45%
Chunghwa Post Co., Ltd. 10,302,200 1.37%
Old labor pension fund 10,181,240 1.35%
Public Service Pension Fund Management Board 9,609,960 1.28%
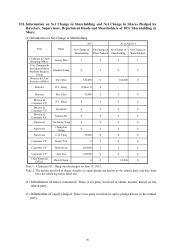
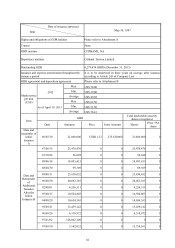
(5) Market Price, Net Worth, Earnings & Dividend per Share of the Last Two Years
Market Price, Net Worth, Earnings & Dividend per Share
Unit: NT$/Share
Fiscal year
Item 2011 2012
As of March 31,
2013
(Note 9)
Market price per
share
(Note 1) (Note 3)
Max. 311 342 382
Min. 178 212 316
Average 246.87 287.28 345.64
Net worth per
share (Note 2)
Before appropriation 152.70 167.47 -
After appropriation 138.20 (ຏ8)
Earnings per share
Weighted average shares
(Note 3)
753,776
thousand
shares
752,760
thousand
shares
-
Earnings per
shares (Note 3)
Before adjustment 21.99 29.79 -
After adjustment 21.99 (Note 8)
Dividends per
share
Cash dividends 14.5 (Note 8) -
Stock
dividends
Stock dividends
from Retained
earnings
0 (Note 8) -
Stock dividends
from Additional
paid-in capital
0 (Note 8) -
Accumulated unpaid dividends
(Note 4) - - -
Analysis of return
on investment
Price/Earning Ratio (Note 5) 11.23 9.64 -
Price/Dividend Ratio (Note 6) 17.03 (Note 8) -
Cash dividends yield rate (Note 7) 5.87ʘ(Note 8) -
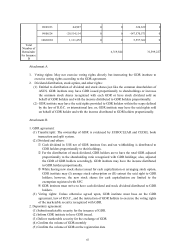
Note 1: List the highest and lowest market price per share; also, calculate the average market price per share in accordance
with the trade amount and shares.
Note 2: Please base the information on the shares issued at yearned and the resolution for stock distribution in shareholders
meeting.
Note 3: If the stock dividend is to be adjusted retroactively, please list the earnings per share before and after the