Amgen 2007 Annual Report Download - page 2
Download and view the complete annual report
Please find page 2 of the 2007 Amgen annual report below. You can navigate through the pages in the report by either clicking on the pages listed below, or by using the keyword search tool below to find specific information within the annual report.-
 1
1 -
 2
2 -
 3
3 -
 4
4 -
 5
5 -
 6
6 -
 7
7 -
 8
8 -
 9
9 -
 10
10 -
 11
11 -
 12
12 -
 13
13 -
14
-
15
-
16
-
17
-
18
-
19
-
20
-
21
-
22
-
23
-
24
-
25
-
26
-
27
-
28
-
29
-
30
-
31
-
32
-
33
-
34
-
35
-
36
-
37
-
38
-
39
-
40
-
41
-
42
-
43
-
44
-
45
-
46
-
47
-
48
-
49
-
50
-
51
-
52
-
53
-
54
-
55
-
56
-
57
-
58
-
59
-
60
-
61
-
62
-
63
-
64
-
65
-
66
-
67
-
68
-
69
-
70
-
71
-
72
-
73
-
74
-
75
-
76
-
77
-
78
-
79
-
80
-
81
-
82
-
83
-
84
-
85
-
86
-
87
-
88
-
89
-
90
-
91
-
92
-
93
-
94
-
95
-
96
-
97
-
98
-
99
-
100
-
101
-
102
-
103
-
104
-
105
-
106
-
107
-
108
-
109
-
110
-
111
-
112
-
113
-
114
-
115
-
116
-
117
-
118
-
119
-
120
-
121
-
122
-
123
-
124
-
125
-
126
-
127
-
128
-
129
-
130
-
131
-
132
-
133
-
134
-
135
-
136
-
137
-
138
-
139
-
140
-
141
-
142
-
143
-
144
-
145
-
146
-
147
-
148
-
149
-
150
-
151
-
152
-
153
-
154
-
155
-
156
-
157
-
158
-
159
-
160
-
161
-
162
-
163
-
164
-
165
-
166
-
167
-
168
-
169
-
170
-
171
-
172
-
173
-
174
-
175
-
176
-
177
-
178
-
179
-
180
 |
 |

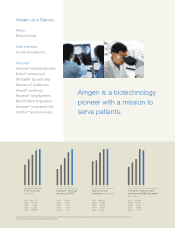
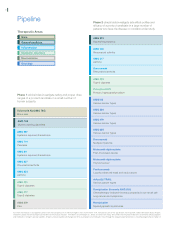
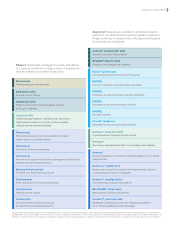
Amgen is a biotechnology
pioneer with a mission to
serve patients.
Sector:
Biotechnology
Core business:
Human therapeutics
Products:
Aranesp® (darbepoetin alfa)
Enbrel® (etanercept)
EPOGEN® (Epoetin alfa)
Kepivance® (palifermin)
Kineret® (anakinra)
Neulasta® (pegfilgrastim)
NEUPOGEN® (Filgrastim)
Sensipar® (cinacalcet HCl)
Vectibix™ (panitumumab)
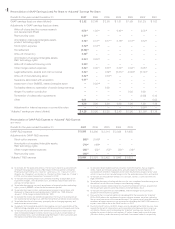
Amgen at a Glance
2007 $4.29
2006 3.90
2005 3.20
2004 2.40
2003 1.90
“Adjusted” earnings
per share (EPS)*
04 05 0603
Cash flow from
operations ($ in millions)
2007 $5,401
2006 5,389
2005 4,911
2004 3,697
2003 3,567
04 05 0603
Total revenues
($ in millions)
2007 $14,771
2006 14,268
2005 12,430
2004 10,550
2003 8,356
04 05 0603
“Adjusted” research and
development (R&D) expenses*
($ in millions)
2007 $3,064
2006 3,191
2005 2,302
2004 1,996
2003 1,621
04 05 0603
* “ Adjusted” EPS and “adjusted” R&D expenses are non-GAAP financial measures. See page 6 for reconciliations of these non-GAAP financial measures to
U.S. Generally Accepted Accounting Principles (GAAP).
07 07 07 07