Alpine 2007 Annual Report Download - page 15
Download and view the complete annual report
Please find page 15 of the 2007 Alpine annual report below. You can navigate through the pages in the report by either clicking on the pages listed below, or by using the keyword search tool below to find specific information within the annual report.-
 1
1 -
2
-
3
-
4
-
 5
5 -
 6
6 -
 7
7 -
 8
8 -
 9
9 -
 10
10 -
 11
11 -
 12
12 -
 13
13 -
 14
14 -
 15
15 -
 16
16 -
 17
17 -
 18
18 -
 19
19 -
 20
20 -
 21
21 -
 22
22 -
 23
23 -
 24
24 -
 25
25 -
26
-
27
-
28
-
29
-
30
-
31
-
32
-
33
-
34
-
35
-
36
-
37
-
38
-
39
-
40
 |
 |

13
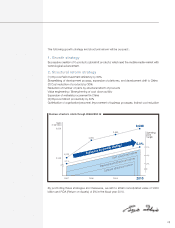
to products in diffusion price zones in spite of sales expansion measures taken in the second
half of the fi scal year.
On the other hand, sales to automobile manufacturers increased due to strong sales to
Japanese makers and contribution of new products for new cars introduced in the second half
of the year, while sales to the US makers declined.
As a result, sales of this segment increased 8.7% year on the year.
(Note)
Starting from the consolidated fi scal year ended March 31, 2007, product classifi cation in segmentation by
the type of business has been changed. Comparison with the corresponding period of the previous year is
given by rearranging the fi gures of the previous fi scal year in accordance with the new classifi cation. (Note15)
Overall, for consolidated performance during the fi scal year under review, net sales jumped
4.4% to ¥265,055 million (US$2,245.3 million), operating income rises 4.5% to ¥10,110 million
(US$85.6 million), while net income decreased 7.2% to ¥5,729 million (US$48.5 million), due
to the prior product compensation expense and so on. Net income per share was ¥82.12
(US$0.70).
The number of consolidated subsidiaries changed to 28 companies, with 8 companies in
Japan and 20 overseas. The number of companies accounted for by the equity method at the
end of the fi scal year remained at 1.
Investment
Capital expenditures increased 17.1% to ¥12,620 million (US$106.9 million). By segment,
investment in the Audio Products business totaled ¥7,317 million (US$62.0 million), and that in
the Information and Communication Equipment business amounted to ¥5,303 million (US$44.9
million).
R&D expenses rose 5.8% to ¥30,347 million (US$257.1 million). R&D expenses amounted to
11.4% of net sales, up 0.1 percentage points.
Cash Flows
For the fi scal year under review, cash and cash equivalents at the end of the period totaled
¥37,507 million (US$317.7 million), an increase of ¥4,300 million (US$36.4 million), or 12.9%,
compared with the previous fi scal year-end.
Cash fl ows from operating activities
Net cash provided by operating activities amounted to ¥16,399 million (US$138.9 million), an
increase of 27.3%. This was mainly the result of infl ows provided by net income before taxes
and other adjustments of ¥10,302 million (US$87.3 million), depreciation and amortization of
¥9,326 million (US$79.0 million) and decrease in notes and accounts receivable of ¥3,504
million (US$29.7 million), and Income taxes paid of ¥3,692 million (US$31.3 million) from the
payment of income and other taxes.
Cash fl ows from investing activities
Net cash used in investing activities was ¥11,887 million (US$100.7 million), up 20.6%
compared with the previous fiscal year. Principal components were payments for the
acquisition of tangible and intangible fixed assets of ¥8,573 million (US$72.6 million) and
¥3,593 million (US$30.4 million), respectively.
Cash fl ows from fi nancing activities
Net cash used in fi nancing activities totaled ¥1,541 million (US$13.0 million), up 0.2%. The
principal component was cash dividends paid of ¥1,395 million (US$11.8 million).
Financial Position
Total assets at the end of the year increased 6.9% to ¥181,185 million (US$1,534.8 million),
primarily due to an increase in cash and cash equivalents, fixed assets and investment in
securities. As a result of the increase in retained earnings and unrealized holding gains on
securities, total net assets grew 7.6% to ¥120,908 million (US$1,024.2 million). The equity ratio
rose 0.4 percentage points to 65.7%.
Return on equity was 5.0%, a decrease of 1.2 of a percentage point. Return on assets was
3.3%, a decrease of 0.5 of a percentage point.
&DVK)ORZV
0LOOLRQVRI\HQ
&DVK)ORZVIURP2SHUDWLQJ$FWLYLW\
)UHH&DVK)ORZ
5HWXUQRQ(TXLW\5HWXUQRQ$VVHWV
5HWXUQRQ(TXLW\
5XWXUQRQ$VVHWV
&DVK'LYLGHQGV
g