Alcoa 2013 Annual Report Download - page 6
Download and view the complete annual report
Please find page 6 of the 2013 Alcoa annual report below. You can navigate through the pages in the report by either clicking on the pages listed below, or by using the keyword search tool below to find specific information within the annual report.-
 1
1 -
 2
2 -
 3
3 -
 4
4 -
 5
5 -
 6
6 -
 7
7 -
 8
8 -
 9
9 -
 10
10 -
 11
11 -
 12
12 -
 13
13 -
 14
14 -
 15
15 -
 16
16 -
 17
17 -
18
-
19
-
20
-
21
-
22
-
23
-
24
-
25
-
26
-
27
-
28
-
29
-
30
-
31
-
32
-
33
-
34
-
35
-
36
-
37
-
38
-
39
-
40
-
41
-
42
-
43
-
44
-
45
-
46
-
47
-
48
-
49
-
50
-
51
-
52
-
53
-
54
-
55
-
56
-
57
-
58
-
59
-
60
-
61
-
62
-
63
-
64
-
65
-
66
-
67
-
68
-
69
-
70
-
71
-
72
-
73
-
74
-
75
-
76
-
77
-
78
-
79
-
80
-
81
-
82
-
83
-
84
-
85
-
86
-
87
-
88
-
89
-
90
-
91
-
92
-
93
-
94
-
95
-
96
-
97
-
98
-
99
-
100
-
101
-
102
-
103
-
104
-
105
-
106
-
107
-
108
-
109
-
110
-
111
-
112
-
113
-
114
-
115
-
116
-
117
-
118
-
119
-
120
-
121
-
122
-
123
-
124
-
125
-
126
-
127
-
128
-
129
-
130
-
131
-
132
-
133
-
134
-
135
-
136
-
137
-
138
-
139
-
140
-
141
-
142
-
143
-
144
-
145
-
146
-
147
-
148
-
149
-
150
-
151
-
152
-
153
-
154
-
155
-
156
-
157
-
158
-
159
-
160
-
161
-
162
-
163
-
164
-
165
-
166
-
167
-
168
-
169
-
170
-
171
-
172
-
173
-
174
-
175
-
176
-
177
-
178
-
179
-
180
-
181
-
182
-
183
-
184
-
185
-
186
-
187
-
188
-
189
-
190
-
191
-
192
-
193
-
194
-
195
-
196
-
197
-
198
-
199
-
200
-
201
-
202
-
203
-
204
-
205
-
206
-
207
-
208
 |
 |

4
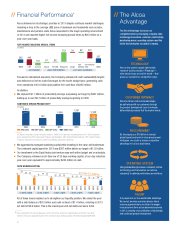
// The Alcoa
Advantage
The Alcoa Advantage increases our
competitiveness by leveraging company-wide
technology innovations, customer relationships,
purchasing power, operating systems and the
talent that underpins our global company.
// Financial Performance*
Alcoa delivered on its strategic priorities in 2013 despite continued market challenges
including a drop in the average LME price of aluminum and headwinds such as labor,
maintenance and pension costs. Alcoa responded to the tough operating environment
in 2013 and reported higher net income excluding special items by $95 million on a
year-over-year basis.
Focused on disciplined execution, the Company achieved its cash sustainability targets
and delivered on its free cash flow target for the fourth straight year, generating cash
from operations of $1.6 billion and positive free cash flow of $385 million.
In addition:
n We captured $1.1 billion of productivity savings, surpassing our target by $367 million,
adding up to over $6.7 billion of productivity savings beginning in 2009.
n We aggressively managed sustaining capital while investing in the value-add businesses.
The combined capital spend for 2013 was $357 million below our target of $1.55 billion.
n Our investment in the Saudi Arabia joint venture was well within budget and on schedule.
n The Company achieved an all-time low of 20 days working capital, a four-day reduction
year-over-year equivalent to approximately $240 million in cash.
All of these levers enabled us to strengthen our liquidity position. We ended the year
with a debt balance of $8.3 billion and cash on hand of $1.4 billion, resulting in 2013
net debt of $6.9 billion. This is the lowest year-end net debt level since 2006.
We run the world’s largest light metals
research facility outside of Pittsburgh—
with similar hubs around the world—that
gives our customers a competitive edge.
TECHNOLOGY
By leveraging our $18 billion in annual
global spend and best-in-class procurement
strategies, we create a unique competitive
advantage for all our businesses.
PROCUREMENT
Using standardized processes, consistent metrics,
terminology and frameworks, we remove
complexity to optimize performance across Alcoa.
OPERATING SYSTEM
Our people are our true sustainable advantage.
We recruit, develop and retain diverse talent,
sourcing approximately one third of manager-
level personnel from across business segments
in 2013, ensuring cross-pollination of knowledge
and continued people development.
TALENT
We drive Alcoa’s commercial advantage
by partnering with our customers through
the product development cycle to innovate
differentiated products that the market wants.
CUSTOMER INTIMACY
43
55 50 48
33 41 44 43
30
39 38 38
27 32 33 33
24 28 27 28 20
4Q08
1Q09
2Q09
3Q09
4Q09
1Q10
2Q10
3Q10
4Q10
1Q11
2Q11
3Q11
4Q11
1Q12
2Q12
3Q12
4Q12
1Q13
2Q13
3Q13
4Q13
23 days: $1.4 Billion
10 DAYS LOWER 3 DAYS LOWER 3 DAYS LOWER 3 DAYS LOWER 4 DAYS LOWER
DAYS WORKING CAPITAL
2012 2013LME Currency Volume Price/Mix Productivity Energy
Cost Increases/
Other
Raw
Materials
-$273 MARKET +$842 PERFORMANCE -$474 COST HEADWINDS
$ in millions
262 445
172 57 32
753 29 62 507
357
NET INCOME EXCLUDING SPECIAL ITEMS
2009 2010 2011 2012 2013
EPS (32%)GRP (24%)GPP (43%)OTHER (1%)
2,410
742
1,099 1,291 1,117
356
268
481
12
$ in millions
CONTINUED STRONG PRODUCTIVITY
All figures are pretax and pre-minority interest. 2009-2010 represent net productivity. 2011-2013 represent
gross productivity. EPS: Engineered Products and Solutions; GRP: Global Rolled Products; GPP: Global Primary
Products represents the Alumina and Primary Metals segments combined.
* See Calculation of Financial Measures at the end of this report for reconciliations of certain non-GAAP
financial measures (adjusted income, free cash flow, days working capital, net debt and adjusted EBITDA).