Alcoa 1999 Annual Report Download - page 3
Download and view the complete annual report
Please find page 3 of the 1999 Alcoa annual report below. You can navigate through the pages in the report by either clicking on the pages listed below, or by using the keyword search tool below to find specific information within the annual report.-
 1
1 -
 2
2 -
 3
3 -
 4
4 -
 5
5 -
 6
6 -
 7
7 -
 8
8 -
 9
9 -
 10
10 -
 11
11 -
 12
12 -
 13
13 -
 14
14 -
15
-
16
-
17
-
18
-
19
-
20
-
21
-
22
-
23
-
24
-
25
-
26
-
27
-
28
-
29
-
30
-
31
-
32
-
33
-
34
-
35
-
36
-
37
-
38
-
39
-
40
-
41
-
42
-
43
-
44
-
45
-
46
-
47
-
48
-
49
-
50
-
51
-
52
-
53
-
54
-
55
-
56
-
57
-
58
-
59
-
60
-
61
-
62
-
63
-
64
-
65
-
66
-
67
-
68
-
69
-
70
 |
 |

1
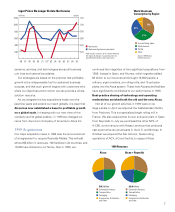
Financial and Operating Highlights
(dollars in millions, except share amounts)
BY MARKET
25% Transportation
20% Packaging
18% Distribution and Other
13% Aluminum Ingot
13% Building and Construction
11% Alumina and Chemicals
BY COUNTRY
64% U.S.
9% Australia
6% Spain
4% Brazil
3% Germany
14% Other
1999 Revenues: $16.3 Billion
13%
11%
25%
20%
18%
3%
64%
14%
6%
9%
4%
1999 1998 % change
Sales $16,323 $15,340 6
Income from operations 1,296 1,091 19
Net income 1,054 853 24
Per common share:
Basic earnings 2.87 2.44 18
Diluted earnings 2.82 2.42 17
Dividends paid .805 .75 7
Book value 17.03 16.36 4
Total assets 17,066 17,463 (2)
Capital expenditures 920 932 (1)
Cash flow from operations 2,236 2,197 2
Return on average shareholders’ equity 17.2% 16.3% 6
Debt as a percent of invested capital 28% 32% (13)
Interest coverage ratio 8.3 7.4 12
Current assets / liabilities ratio 1.6 to 1 1.5 to 1 –
Price/earnings (P/E) ratio 29.4 15.4 91
Shipments of aluminum products (000 metric tons) 4,478 3,951 13
Number of shareholders 185,000 119,000 55
Average common shares outstanding (000) 366,944 349,114 5
Number of employees 107,700 103,500 4
13%