Aer Lingus 2012 Annual Report Download - page 16
Download and view the complete annual report
Please find page 16 of the 2012 Aer Lingus annual report below. You can navigate through the pages in the report by either clicking on the pages listed below, or by using the keyword search tool below to find specific information within the annual report.-
 1
1 -
2
-
3
-
4
-
5
-
 6
6 -
 7
7 -
 8
8 -
 9
9 -
 10
10 -
 11
11 -
 12
12 -
 13
13 -
 14
14 -
 15
15 -
 16
16 -
 17
17 -
 18
18 -
 19
19 -
 20
20 -
 21
21 -
 22
22 -
 23
23 -
 24
24 -
 25
25 -
 26
26 -
27
-
28
-
29
-
30
-
31
-
32
-
33
-
34
-
35
-
36
-
37
-
38
-
39
-
40
-
41
-
42
-
43
-
44
-
45
-
46
-
47
-
48
-
49
-
50
-
51
-
52
-
53
-
54
-
55
-
56
-
57
-
58
-
59
-
60
-
61
-
62
-
63
-
64
-
65
-
66
-
67
-
68
-
69
-
70
-
71
-
72
-
73
-
74
-
75
-
76
-
77
-
78
-
79
-
80
-
81
-
82
-
83
-
84
-
85
-
86
-
87
-
88
-
89
-
90
-
91
-
92
-
93
-
94
-
95
-
96
-
97
-
98
-
99
-
100
-
101
-
102
-
103
-
104
-
105
-
106
-
107
-
108
-
109
-
110
-
111
-
112
-
113
-
114
-
115
-
116
-
117
-
118
-
119
-
120
-
121
-
122
-
123
-
124
 |
 |

2012 FINANCIAL REVIEW Aer Lingus Group Plc
ANNUAL REPORT 2012
14
Introduction
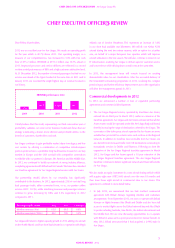
Aer Lingus delivered an operating profit, before net exceptional items, of €69.1 million for 2012 (2011: profit of €49.1 million). This excellent operating
result builds on the strong performance achieved under the successful turnaround strategy for the Group and represents the third consecutive year of
operating profitability since 2009. From a loss before exceptional items of €81.0 million in 2009, we have successively reported operating profits, before
exceptional items, of €52.5 million in 2010, €49.1 million in 2011 and now €69.1 million for 2012.
The 2012 operating result was achieved against a difficult economic backdrop, characterised by weak demand in our key Irish and UK markets and also
significant inflationary pressure on non-controllable costs, principally fuel and airport charges. In addition to an effective performance on revenue and
cost control, the 2012 full year result has also benefited from the non-recurrence of operational disruption in Q1 2011 which was estimated to have cost
approximately €15 million in lost revenue and additional costs.
Net profit before tax of €40.6 million for 2012 was €43.8 million, or 51.9% below the figure recorded for 2011. However, the decrease in pre-tax profit
can be attributed to exceptional items and is not reflective of the underlying profitability of the business. In 2011, exceptional gains were recorded on the
surrender of the Group’s leasehold interest in the Head Office Building at Dublin Airport to DAA plc and also from releases of amounts from the cash flow
hedging reserve relating to foreign currency hedges on long haul aircraft orders that became surplus to requirements. In 2012, exceptional items include
costs associated with restructuring our Shannon aircraft maintenance operations and legal and professional fees associated with Ryanair’s third takeover
offer for the Group which was formally made on 17 July 2012.
Passenger revenue
2012 2011 % Increase/
(decrease)
Passenger fare revenue (€ million) 1,159.8 1,068.0 8.6%
Passenger numbers (‘000s)
(excluding Aer Lingus Regional and UA codeshare) 9,653 9,513 1.5%
ASKs (million) 18,685 18,593 0.5%
Load Factor 77.7% 75.6% 2.1 pts
Yield per passenger (€) 120.15 112.27 7.0%
Fare revenue per seat (€) 88.70 82.31 7.8%
Passenger fare revenue for the year was 8.6% ahead of 2011 driven by higher passenger numbers (+1.5%), an increase in load factor (+2.1 pts), and
increased yield (+7.0%). Capacity (measured by ASKs) increased by just 0.5%. The positive figures fully reflect the success of our current strategy of carefully
managing capacity deployment across the network, focusing on higher yielding, time sensitive demand to drive increases in yield and fare revenue per seat.
Short haul
Short haul performance 2012 2011 % Increase/
(decrease)
Short haul passenger Revenue
(€ million) 816.3 781.0 4.5%
Short haul passengers (‘000s)
(excluding Aer Lingus Regional) 8,674 8,616 0.7%
Load Factor 75.4% 74.6% 0.8 pts
Yield per passenger (€) 94.11 90.65 3.8%
Fare revenue per seat (€) 68.67 66.09 3.9%
Short haul fare revenue increased by 4.5% in 2012 to €816.3 million (2011: €781.0 million). The positive revenue performance was driven by a 0.7%
increase in passenger numbers (excluding Aer Lingus Regional), a 0.8 pt increase in load factor and a 3.9% increase in fare revenue per seat. Yield per short
haul passenger increased by 3.8% and continues a positive trend in yield growth on short haul over the past three financial years.
2012 FINANCIAL REVIEW