Aarons 2011 Annual Report Download - page 3
Download and view the complete annual report
Please find page 3 of the 2011 Aarons annual report below. You can navigate through the pages in the report by either clicking on the pages listed below, or by using the keyword search tool below to find specific information within the annual report.-
 1
1 -
 2
2 -
 3
3 -
 4
4 -
 5
5 -
 6
6 -
 7
7 -
 8
8 -
 9
9 -
 10
10 -
 11
11 -
 12
12 -
 13
13 -
 14
14 -
15
-
16
-
17
-
18
-
19
-
20
-
21
-
22
-
23
-
24
-
25
-
26
-
27
-
28
-
29
-
30
-
31
-
32
-
33
-
34
-
35
-
36
-
37
-
38
-
39
-
40
-
41
-
42
-
43
-
44
-
45
-
46
-
47
-
48
-
49
-
50
-
51
-
52
 |
 |

0
80,000
100,000
$120,000
40,000
20,000
60,000
20112010200920082007
0
500,000
750,000
1,000,000
1,250,000
2,000,000
$2,250,000
1,750,000
1,500,000
20112010200920082007
225,000
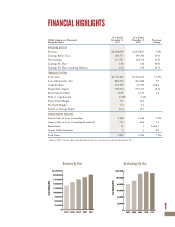
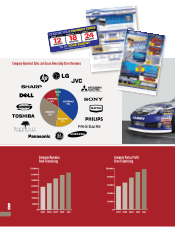
Revenues By Year Net Earnings By Year
($ in thousands)
($ in thousands)
FINANCIAL HIGHLIGHTS
* Aaron’s Sales & Lease Ownership franchised stores are not owned or operated by Aaron’s, Inc.
Year Ended Year Ended
(Dollar Amounts in Thousands, December 31, December 31, Percentage
Except Per Share) 2011 2010 Change
OPERATING RESULTS
Revenues $2,024,049 $1,876,847 7.8%
Earnings Before Taxes 183,377 190,786 (3.9)
Net Earnings 113,767 118,376 (3.9)
Earnings Per Share 1.46 1.46 (0.0)
Earnings Per Share Assuming Dilution 1.43 1.44 (0.7)
FINANCIAL POSITION
Total Assets $1,735,149 $1,502,072 15.5%
Lease Merchandise, Net 862,276 814,484 5.9
Credit Facilities 153,789 41,790 268.0
Shareholders’ Equity 976,554 979,417 (0.3)
Book Value Per Share 12.91 12.23 5.6
Debt to Capitalization 13.6% 4.1%
Pretax Profit Margin 9.1 10.2
Net Profit Margin 5.6 6.3
Return on Average Equity 11.6 12.7
STORES OPEN AT YEAR-END
Aaron’s Sales & Lease Ownership 1,160 1,146 1.2%
Aaron’s Sales & Lease Ownership Franchised* 713 664 7.4
HomeSmart 71 3 2,266.7
Aaron’s Office Furniture 1 1 0.0
Total Stores 1,945 1,814 7.2%
1