Aarons 2006 Annual Report Download - page 3
Download and view the complete annual report
Please find page 3 of the 2006 Aarons annual report below. You can navigate through the pages in the report by either clicking on the pages listed below, or by using the keyword search tool below to find specific information within the annual report.-
 1
1 -
 2
2 -
 3
3 -
 4
4 -
 5
5 -
 6
6 -
 7
7 -
 8
8 -
 9
9 -
 10
10 -
 11
11 -
 12
12 -
 13
13 -
 14
14 -
15
-
16
-
17
-
18
-
19
-
20
-
21
-
22
-
23
-
24
-
25
-
26
-
27
-
28
-
29
-
30
-
31
-
32
-
33
-
34
-
35
-
36
-
37
-
38
-
39
-
40
-
41
-
42
-
43
-
44
-
45
-
46
-
47
-
48
 |
 |

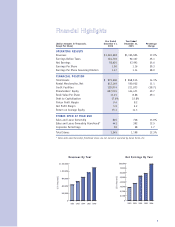
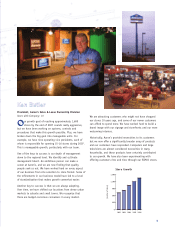
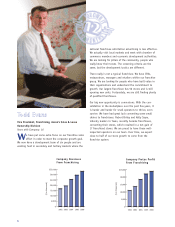
Revenues By Year Net Earnings By Year
Year Ended Year Ended
(Dollar Amounts in Thousands, December 31, December 31, Percentage
Except Per Share) 2006 2005 Change
OPERATING RESULTS
Revenues $1,326,592 $1,125,505 17.9%
Earnings Before Taxes 124,710 92,337 35.1
Net Earnings 78,635 57,993 35.6
Earnings Per Share 1.50 1.16 29.3
Earnings Per Share Assuming Dilution 1.47 1.14 28.9
FINANCIAL POSITION
Total Assets $ 979,606 $ 858,515 14.1%
Rental Merchandise, Net 612,149 550,932 11.1
Credit Facilities 129,974 211,873 (38.7)
Shareholders’ Equity 607,015 434,471 39.7
Book Value Per Share 11.21 8.68 29.1
Debt to Capitalization 17.6% 32.8%
Pretax Profit Margin 9.4 8.2
Net Profit Margin 5.9 5.2
Return on Average Equity 15.1 14.3
STORES OPEN AT YEAR END
Sales and Lease Ownership 845 748 13.0%
Sales and Lease Ownership Franchised* 441 392 12.5
Corporate Furnishings 59 58 1.7
Total Stores 1,345 1,198 12.3%
Financial Highlights
* Sales and Lease Ownership franchised stores are not owned or operated by Aaron Rents, Inc.
0
10,000
20,000
40,000
50,000
60,000
$80,000
30,000
70,000
2004 2005 20062002 2003
($ in thousands)
($ in thousands)
0
300,000
900,000
1,200,000
$1,500,000
600,000
2004 2005 20062002 2003
1