Aarons 2005 Annual Report Download - page 3
Download and view the complete annual report
Please find page 3 of the 2005 Aarons annual report below. You can navigate through the pages in the report by either clicking on the pages listed below, or by using the keyword search tool below to find specific information within the annual report.-
 1
1 -
 2
2 -
 3
3 -
 4
4 -
 5
5 -
 6
6 -
 7
7 -
 8
8 -
 9
9 -
 10
10 -
 11
11 -
 12
12 -
 13
13 -
 14
14 -
15
-
16
-
17
-
18
-
19
-
20
-
21
-
22
-
23
-
24
-
25
-
26
-
27
-
28
-
29
-
30
-
31
-
32
-
33
-
34
-
35
-
36
-
37
-
38
-
39
-
40
-
41
-
42
-
43
-
44
-
45
-
46
-
47
-
48
 |
 |

1
Financial Highlights . . . . . . . . . . . . . . . . . . . 1
Letter to Shareholders . . . . . . . . . . . . . . . . . . 2
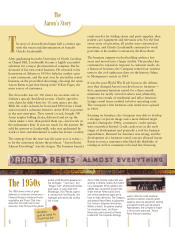
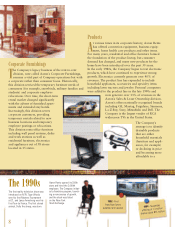
The Aaron’s Story . . . . . . . . . . . . . . . . . . . . .4
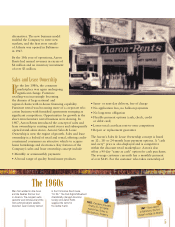
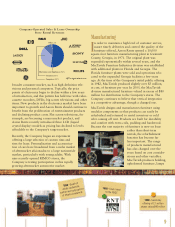
Sales and Lease Ownership . . . . . . . . . . . 5
The Franchise System . . . . . . . . . . . . . . . . 7
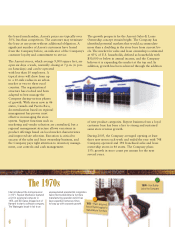
Corporate Furnishings . . . . . . . . . . . . . . . 8
Products . . . . . . . . . . . . . . . . . . . . . . . . . . 8
Manufacturing . . . . . . . . . . . . . . . . . . . . . 9
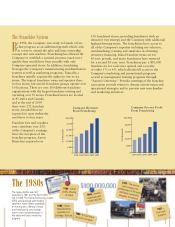
Funding Growth . . . . . . . . . . . . . . . . . . 10
Marketing . . . . . . . . . . . . . . . . . . . . . . . 10
The Aaron’s Corporate Culture . . . . . . . . . 12
Financial Information . . . . . . . . . . . . . . . . . 14
StoreLocations . . . . . . . . . . . . . . . . . . . . . . 43
Board of Directors and Officers . . . . . . . . . 44
Corporate and Shareholder Information . . . 44
Contents
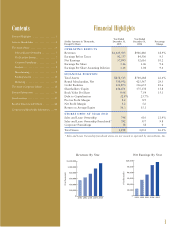
Revenues By Year Net Earnings By Year
Year Ended Year Ended
(Dollar Amounts in Thousands, December 31, December 31, Percentage
Except Per Share) 2005 2004 Change
OPERATING RESULTS
Revenues $1,125,505 $946,480 18.9%
Earnings Before Taxes 92,337 84,506 9.3
Net Earnings 57,993 52,616 10.2
Earnings Per Share 1.16 1.06 9.4
Earnings Per Share Assuming Dilution 1.14 1.04 9.6
FINANCIAL POSITION
Total Assets $858,515 $700,288 22.6%
Rental Merchandise, Net 550,932 425,567 29.5
Credit Facilities 211,873 116,655 81.6
Shareholders’ Equity 434,471 375,178 15.8
Book Value Per Share 8.68 7.54 15.1
Debt to Capitalization 32.8% 23.7%
Pre-tax Profit Margin 8.2 8.9
Net Profit Margin 5.2 5.6
Returnon Average Equity 14.3 15.1
STORES OPEN AT YEAR END
Sales and Lease Ownership 748 616 21.4%
Sales and Lease Ownership Franchised* 392 357 9.8
Corporate Furnishings 58 58 0
Total Stores 1,198 1,031 16.2%
Financial Highlights
*Sales and Lease Ownership franchised stores are not owned or operated by Aaron Rents, Inc.
0
200,000
400,000
600,000
800,000
1,000,000
$1,200,000
2004 20052001 2002 2003
($ in thousands)
0
10,000
20,000
30,000
40,000
50,000
$60,000
2004 20052001 2002 2003
($ in thousands)