APS 2015 Annual Report Download - page 145
Download and view the complete annual report
Please find page 145 of the 2015 APS annual report below. You can navigate through the pages in the report by either clicking on the pages listed below, or by using the keyword search tool below to find specific information within the annual report.-
 1
1 -
2
-
3
-
4
-
5
-
6
-
7
-
8
-
9
-
10
-
11
-
12
-
13
-
14
-
15
-
16
-
17
-
18
-
19
-
20
-
21
-
22
-
23
-
24
-
25
-
26
-
27
-
28
-
29
-
30
-
31
-
32
-
33
-
34
-
35
-
36
-
37
-
38
-
39
-
40
-
41
-
42
-
43
-
44
-
45
-
46
-
47
-
48
-
49
-
50
-
51
-
52
-
53
-
54
-
55
-
56
-
57
-
58
-
59
-
60
-
61
-
62
-
63
-
64
-
65
-
66
-
67
-
68
-
69
-
70
-
71
-
72
-
73
-
74
-
75
-
76
-
77
-
78
-
79
-
80
-
81
-
82
-
83
-
84
-
85
-
86
-
87
-
88
-
89
-
90
-
91
-
92
-
93
-
94
-
95
-
96
-
97
-
98
-
99
-
100
-
101
-
102
-
103
-
104
-
105
-
106
-
107
-
108
-
109
-
110
-
111
-
112
-
113
-
114
-
115
-
116
-
117
-
118
-
119
-
120
-
121
-
122
-
123
-
124
-
125
-
126
-
127
-
128
-
129
-
130
-
131
-
132
-
133
-
134
-
 135
135 -
 136
136 -
 137
137 -
 138
138 -
 139
139 -
 140
140 -
 141
141 -
 142
142 -
 143
143 -
 144
144 -
 145
145 -
 146
146 -
 147
147 -
 148
148 -
 149
149 -
 150
150 -
 151
151 -
 152
152 -
 153
153 -
 154
154 -
 155
155 -
156
-
157
-
158
-
159
-
160
-
161
-
162
-
163
-
164
-
165
-
166
-
167
-
168
-
169
-
170
-
171
-
172
-
173
-
174
-
175
-
176
-
177
-
178
-
179
-
180
-
181
-
182
-
183
-
184
-
185
-
186
-
187
-
188
-
189
-
190
-
191
-
192
-
193
-
194
-
195
-
196
-
197
-
198
-
199
-
200
-
201
-
202
-
203
-
204
-
205
-
206
-
207
-
208
-
209
-
210
-
211
-
212
-
213
-
214
-
215
-
216
-
217
-
218
-
219
-
220
-
221
-
222
-
223
-
224
-
225
-
226
-
227
-
228
-
229
-
230
-
231
-
232
-
233
-
234
-
235
-
236
-
237
-
238
-
239
-
240
-
241
-
242
-
243
-
244
-
245
-
246
-
247
-
248
-
249
-
250
-
251
-
252
-
253
-
254
-
255
-
256
-
257
-
258
-
259
-
260
-
261
-
262
-
263
-
264
 |
 |

Table of Contents
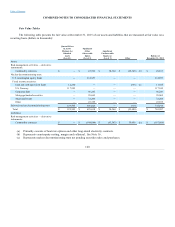
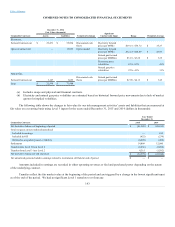
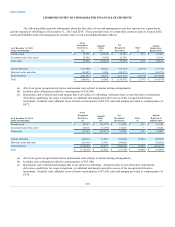
COMBINED NOTES TO CONSOLIDATED FINANCIAL STATEMENTS
Fair Value Tables
The following table presents the fair value at December 31, 2015 of our assets and liabilities that are measured at fair value on a
recurring basis (dollars in thousands):
Quoted Prices
in Active
Markets for
Identical
Assets
(Level 1)
Significant
Other
Observable
Inputs
(Level 2)
Significant
Unobservable
Inputs (a)
(Level 3)
Other
Balance at
December 31, 2015
Assets
Risk management activities — derivative
instruments:
Commodity contracts $ —
$ 22,992
$ 30,364
$ (25,345)
(b)
$ 28,011
Nuclear decommissioning trust:
U.S. commingled equity funds —
314,957
—
—
314,957
Fixed income securities:
Cash and cash equivalent funds 12,260
—
—
(335)
(c)
11,925
U.S. Treasury 117,245
—
—
—
117,245
Corporate debt —
96,243
—
—
96,243
Mortgage-backed securities —
99,065
—
—
99,065
Municipal bonds —
72,206
—
—
72,206
Other —
23,555
—
—
23,555
Subtotal nuclear decommissioning trust 129,505
606,026
—
(335)
735,196
Total $ 129,505
$ 629,018
$ 30,364
$ (25,680)
$ 763,207
Liabilities
Risk management activities — derivative
instruments:
Commodity contracts $ —
$ (144,044)
$ (63,343)
$ 39,698
(b)
$ (167,689)
(a) Primarily consists of heat rate options and other long-dated electricity contracts.
(b) Represents counterparty netting, margin and collateral. See Note 16.
(c) Represents nuclear decommissioning trust net pending securities sales and purchases.
140