APS 2011 Annual Report Download - page 176
Download and view the complete annual report
Please find page 176 of the 2011 APS annual report below. You can navigate through the pages in the report by either clicking on the pages listed below, or by using the keyword search tool below to find specific information within the annual report.-
 1
1 -
2
-
3
-
4
-
5
-
6
-
7
-
8
-
9
-
10
-
11
-
12
-
13
-
14
-
15
-
16
-
17
-
18
-
19
-
20
-
21
-
22
-
23
-
24
-
25
-
26
-
27
-
28
-
29
-
30
-
31
-
32
-
33
-
34
-
35
-
36
-
37
-
38
-
39
-
40
-
41
-
42
-
43
-
44
-
45
-
46
-
47
-
48
-
49
-
50
-
51
-
52
-
53
-
54
-
55
-
56
-
57
-
58
-
59
-
60
-
61
-
62
-
63
-
64
-
65
-
66
-
67
-
68
-
69
-
70
-
71
-
72
-
73
-
74
-
75
-
76
-
77
-
78
-
79
-
80
-
81
-
82
-
83
-
84
-
85
-
86
-
87
-
88
-
89
-
90
-
91
-
92
-
93
-
94
-
95
-
96
-
97
-
98
-
99
-
100
-
101
-
102
-
103
-
104
-
105
-
106
-
107
-
108
-
109
-
110
-
111
-
112
-
113
-
114
-
115
-
116
-
117
-
118
-
119
-
120
-
121
-
122
-
123
-
124
-
125
-
126
-
127
-
128
-
129
-
130
-
131
-
132
-
133
-
134
-
135
-
136
-
137
-
138
-
139
-
140
-
141
-
142
-
143
-
144
-
145
-
146
-
147
-
148
-
149
-
150
-
151
-
152
-
153
-
154
-
155
-
156
-
157
-
158
-
159
-
160
-
161
-
162
-
163
-
164
-
165
-
 166
166 -
 167
167 -
 168
168 -
 169
169 -
 170
170 -
 171
171 -
 172
172 -
 173
173 -
 174
174 -
 175
175 -
 176
176 -
 177
177 -
 178
178 -
 179
179 -
 180
180 -
 181
181 -
 182
182 -
 183
183 -
 184
184 -
 185
185 -
 186
186 -
187
-
188
-
189
-
190
-
191
-
192
-
193
-
194
-
195
-
196
-
197
-
198
-
199
-
200
-
201
-
202
-
203
-
204
-
205
-
206
-
207
-
208
-
209
-
210
-
211
-
212
-
213
-
214
-
215
-
216
-
217
-
218
-
219
-
220
-
221
-
222
-
223
-
224
-
225
-
226
-
227
-
228
-
229
-
230
-
231
-
232
-
233
-
234
-
235
-
236
-
237
-
238
-
239
-
240
-
241
-
242
-
243
-
244
-
245
-
246
-
247
-
248
 |
 |

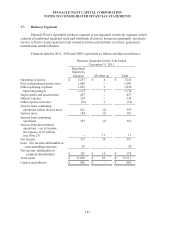
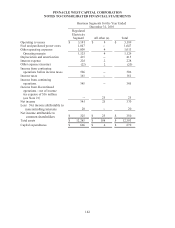
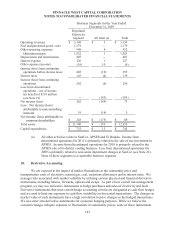
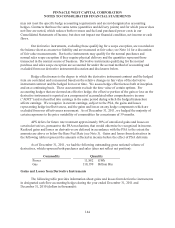
PINNACLE WEST CAPITAL CORPORATION
NOTES TO CONSOLIDATED FINANCIAL STATEMENTS
151
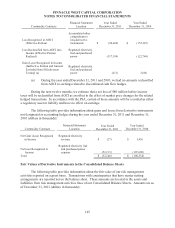
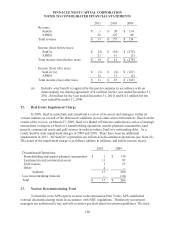
funds are invested in fixed income securities and equity securities. APS classifies investments in
decommissioning trust funds as available for sale. As a result, we record the decommissioning trust
funds at their fair value on our Consolidated Balance Sheets. See Note 14 for a discussion of how
fair value is determined and the classification of the nuclear decommissioning trust investments
within the fair value hierarchy. Because of the ability of APS to recover decommissioning costs in
rates and in accordance with the regulatory treatment for decommissioning trust funds, we have
deferred realized and unrealized gains and losses (including other-than-temporary impairments on
investment securities) in other regulatory liabilities. The following table includes the unrealized
gains and losses based on the original cost of the investment and summarizes the fair value of APS’s
nuclear decommissioning trust fund assets at December 31, 2011 and December 31, 2010 (dollars in
millions):
Fair Value
Total
Unrealized
Gains
Total
Unrealized
Losses
2011
Equity securities $ 175 $ 44 $ (1)
Fixed income securities 340 23 (1)
Net payables (a) (1) -- --
Total $ 514 $ 67 $ (2)
(a) Net payables relate to pending securities sales and purchases.
Fair Value
Total
Unrealized
Gains
Total
Unrealized
Losses
2010
Equity securities $ 168 $ 43 $ (1)
Fixed income securities 312 12 (2)
Net payables (a) (10) -- --
Total $ 470 $ 55 $ (3)
(a) Net payables relate to pending securities sales and purchases.
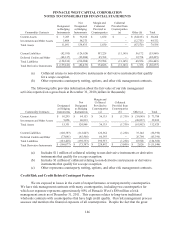
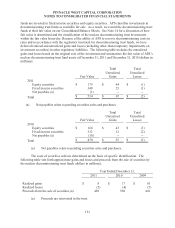
The costs of securities sold are determined on the basis of specific identification. The
following table sets forth approximate gains and losses and proceeds from the sale of securities by
the nuclear decommissioning trust funds (dollars in millions):
Year Ended December 31,
2011 2010 2009
Realized gains $ 8 $ 17 $ 10
Realized losses (5) (4) (7)
Proceeds from the sale of securities (a) 498 560 441
(a) Proceeds are reinvested in the trust.