AIG 2008 Annual Report Download - page 15
Download and view the complete annual report
Please find page 15 of the 2008 AIG annual report below. You can navigate through the pages in the report by either clicking on the pages listed below, or by using the keyword search tool below to find specific information within the annual report.-
 1
1 -
 2
2 -
 3
3 -
 4
4 -
 5
5 -
 6
6 -
 7
7 -
 8
8 -
 9
9 -
 10
10 -
 11
11 -
 12
12 -
 13
13 -
 14
14 -
 15
15 -
 16
16 -
 17
17 -
 18
18 -
 19
19 -
 20
20 -
 21
21 -
 22
22 -
 23
23 -
 24
24 -
 25
25 -
 26
26 -
 27
27 -
 28
28 -
 29
29 -
 30
30 -
 31
31 -
 32
32 -
 33
33 -
 34
34 -
 35
35 -
 36
36 -
 37
37 -
 38
38 -
 39
39 -
 40
40 -
 41
41 -
 42
42 -
 43
43 -
 44
44 -
 45
45 -
 46
46 -
 47
47 -
 48
48 -
 49
49 -
 50
50 -
 51
51 -
 52
52 -
 53
53 -
 54
54 -
 55
55 -
 56
56 -
 57
57 -
 58
58 -
 59
59 -
 60
60 -
 61
61 -
 62
62 -
 63
63 -
 64
64 -
 65
65 -
 66
66 -
 67
67 -
 68
68 -
 69
69 -
 70
70 -
 71
71 -
 72
72 -
 73
73 -
 74
74 -
 75
75 -
 76
76 -
 77
77 -
 78
78 -
 79
79 -
 80
80 -
 81
81 -
 82
82 -
 83
83 -
 84
84 -
 85
85 -
 86
86 -
 87
87 -
 88
88 -
 89
89 -
 90
90 -
 91
91 -
 92
92 -
 93
93 -
 94
94 -
 95
95 -
 96
96 -
 97
97 -
 98
98 -
 99
99 -
 100
100 -
 101
101 -
 102
102 -
 103
103 -
 104
104 -
 105
105 -
 106
106 -
 107
107 -
 108
108 -
 109
109 -
 110
110 -
 111
111 -
 112
112 -
 113
113 -
 114
114 -
 115
115 -
 116
116 -
 117
117 -
 118
118 -
 119
119 -
 120
120 -
 121
121 -
 122
122 -
 123
123 -
 124
124 -
 125
125 -
 126
126 -
 127
127 -
 128
128 -
 129
129 -
 130
130 -
 131
131 -
 132
132 -
 133
133 -
 134
134 -
 135
135 -
 136
136 -
 137
137 -
 138
138 -
 139
139 -
 140
140 -
 141
141 -
 142
142 -
 143
143 -
 144
144 -
 145
145 -
 146
146 -
 147
147 -
 148
148 -
 149
149 -
 150
150 -
 151
151 -
 152
152 -
 153
153 -
 154
154 -
 155
155 -
 156
156 -
 157
157 -
 158
158 -
 159
159 -
 160
160 -
 161
161 -
 162
162 -
 163
163 -
 164
164 -
 165
165 -
 166
166 -
 167
167 -
 168
168 -
 169
169 -
 170
170 -
 171
171 -
 172
172 -
 173
173 -
 174
174 -
 175
175 -
 176
176 -
 177
177 -
 178
178 -
 179
179 -
 180
180 -
 181
181 -
 182
182 -
 183
183 -
 184
184 -
 185
185 -
 186
186 -
 187
187 -
 188
188 -
 189
189 -
 190
190 -
 191
191 -
 192
192 -
 193
193 -
 194
194 -
 195
195 -
 196
196 -
 197
197 -
 198
198 -
 199
199 -
 200
200 -
 201
201 -
 202
202 -
 203
203 -
 204
204 -
 205
205 -
 206
206 -
 207
207 -
 208
208 -
 209
209 -
 210
210 -
 211
211 -
 212
212 -
 213
213 -
 214
214 -
 215
215 -
 216
216 -
 217
217 -
 218
218 -
 219
219 -
 220
220 -
 221
221 -
 222
222 -
 223
223 -
 224
224 -
 225
225 -
 226
226 -
 227
227 -
 228
228 -
 229
229 -
 230
230 -
 231
231 -
 232
232 -
 233
233 -
 234
234 -
 235
235 -
 236
236 -
 237
237 -
 238
238 -
 239
239 -
 240
240 -
 241
241 -
 242
242 -
 243
243 -
 244
244 -
 245
245 -
 246
246 -
 247
247 -
 248
248 -
 249
249 -
 250
250 -
 251
251 -
 252
252 -
 253
253 -
 254
254 -
 255
255 -
 256
256 -
 257
257 -
 258
258 -
 259
259 -
 260
260 -
 261
261 -
 262
262 -
 263
263 -
 264
264 -
 265
265 -
 266
266 -
 267
267 -
 268
268 -
 269
269 -
 270
270 -
 271
271 -
 272
272 -
 273
273 -
 274
274 -
 275
275 -
 276
276 -
 277
277 -
 278
278 -
 279
279 -
 280
280 -
 281
281 -
 282
282 -
 283
283 -
 284
284 -
 285
285 -
 286
286 -
 287
287 -
 288
288 -
 289
289 -
 290
290 -
 291
291 -
 292
292 -
 293
293 -
 294
294 -
 295
295 -
 296
296 -
 297
297 -
 298
298 -
 299
299 -
 300
300 -
 301
301 -
 302
302 -
 303
303 -
 304
304 -
 305
305 -
 306
306 -
 307
307 -
 308
308 -
 309
309 -
 310
310 -
 311
311 -
 312
312 -
 313
313 -
 314
314 -
 315
315 -
 316
316 -
 317
317 -
 318
318 -
 319
319 -
 320
320 -
 321
321 -
 322
322 -
 323
323 -
 324
324 -
 325
325 -
 326
326 -
 327
327 -
 328
328 -
 329
329 -
 330
330 -
 331
331 -
 332
332 -
 333
333 -
 334
334 -
 335
335 -
 336
336 -
 337
337 -
 338
338 -
 339
339 -
 340
340 -
 341
341 -
 342
342 -
 343
343 -
 344
344 -
 345
345 -
 346
346 -
 347
347 -
 348
348 -
 349
349 -
 350
350 -
 351
351 -
 352
352
 |
 |
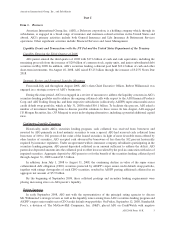
The liability for unpaid claims and claims adjustment expense (loss reserves) established with respect to
foreign business are set and monitored in terms of the currency in which payment is expected to be made. Therefore,
no assumption is included for changes in currency rates. See also Note 1(dd) to the Consolidated Financial
Statements.
Management reviews the adequacy of established loss reserves utilizing a number of analytical reserve
development techniques. Through the use of these techniques, management is able to monitor the adequacy of
AIG’s established reserves and determine appropriate assumptions for inflation. Also, analysis of emerging specific
development patterns, such as case reserve redundancies or deficiencies and IBNR emergence, allows management
to determine any required adjustments.
The “Analysis of Consolidated Losses and Loss Expense Reserve Development” table presents the devel-
opment of net losses and loss expense reserves for calendar years 1998 through 2008. Immediately following this
table is a second table that presents all data on a basis that excludes asbestos and environmental net losses and loss
expense reserve development. The opening reserves held are shown at the top of the table for each year-end date.
The amount of loss reserve discount included in the opening reserve at each date is shown immediately below the
reserves held for each year. The undiscounted reserve at each date is thus the sum of the discount and the reserve
held.
The upper half of the table presents the cumulative amounts paid during successive years related to the
undiscounted opening loss reserves. For example, in the table that excludes asbestos and environmental losses, with
respect to the net losses and loss expense reserve of $25.29 billion at December 31, 2001, by the end of 2008 (seven
years later) $36.35 billion had actually been paid in settlement of these net loss reserves. In addition, as reflected in
the lower section of the table, the original undiscounted reserve of $26.71 billion was reestimated to be
$46.69 billion at December 31, 2008. This increase from the original estimate generally results from a combination
of a number of factors, including reserves being settled for larger amounts than originally estimated. The original
estimates will also be increased or decreased as more information becomes known about the individual claims and
overall claim frequency and severity patterns. The redundancy (deficiency) depicted in the table, for any particular
calendar year, presents the aggregate change in estimates over the period of years subsequent to the calendar year
reflected at the top of the respective column heading. For example, the deficiency of $107 million at December 31,
2008 related to December 31, 2007 net losses and loss expense reserves of $70.03 billion represents the cumulative
amount by which reserves in 2007 and prior years have developed unfavorably during 2008.
The bottom of each table below presents the remaining undiscounted and discounted net loss reserve for each
year. For example, in the table that excludes asbestos and environmental losses, for the 2003 year-end, the
remaining undiscounted reserves held at December 31, 2008 are $15.40 billion, with a corresponding discounted
net reserve of $14.36 billion.
AIG 2008 Form 10-K 9
American International Group, Inc., and Subsidiaries
