ADT 2013 Annual Report Download - page 106
Download and view the complete annual report
Please find page 106 of the 2013 ADT annual report below. You can navigate through the pages in the report by either clicking on the pages listed below, or by using the keyword search tool below to find specific information within the annual report.-
 1
1 -
2
-
3
-
4
-
5
-
6
-
7
-
8
-
9
-
10
-
11
-
12
-
13
-
14
-
15
-
16
-
17
-
18
-
19
-
20
-
21
-
22
-
23
-
24
-
25
-
26
-
27
-
28
-
29
-
30
-
31
-
32
-
33
-
34
-
35
-
36
-
37
-
38
-
39
-
40
-
41
-
42
-
43
-
44
-
45
-
46
-
47
-
48
-
49
-
50
-
51
-
52
-
53
-
54
-
55
-
56
-
57
-
58
-
59
-
60
-
61
-
62
-
63
-
64
-
65
-
66
-
67
-
68
-
69
-
70
-
71
-
72
-
73
-
74
-
75
-
76
-
77
-
78
-
79
-
80
-
81
-
82
-
83
-
84
-
85
-
86
-
87
-
88
-
89
-
90
-
91
-
92
-
93
-
94
-
95
-
 96
96 -
 97
97 -
 98
98 -
 99
99 -
 100
100 -
 101
101 -
 102
102 -
 103
103 -
 104
104 -
 105
105 -
 106
106 -
 107
107 -
 108
108 -
 109
109 -
 110
110 -
 111
111 -
 112
112 -
 113
113 -
 114
114 -
 115
115 -
 116
116 -
117
-
118
-
119
-
120
-
121
-
122
-
123
-
124
-
125
-
126
-
127
-
128
-
129
-
130
-
131
-
132
-
133
-
134
-
135
-
136
-
137
-
138
-
139
-
140
-
141
-
142
-
143
-
144
-
145
-
146
-
147
-
148
-
149
-
150
-
151
-
152
-
153
-
154
-
155
-
156
-
157
-
158
-
159
-
160
-
161
-
162
-
163
-
164
-
165
-
166
-
167
-
168
-
169
-
170
-
171
-
172
 |
 |

FORM 10-K
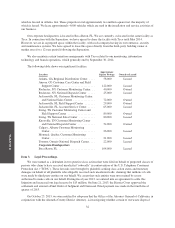
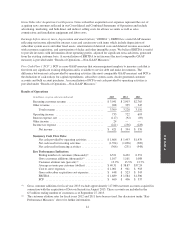
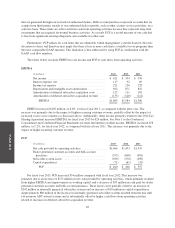
As mentioned above, we manage our business to optimize a number of factors including: customer
additions, costs associated with adding new customers, average revenue per customer, costs related to providing
services to customers and customer tenure. In order to understand how these key factors impact our Consolidated
and Combined Statements of Operations, we consider the following components of our expenses: cost to serve
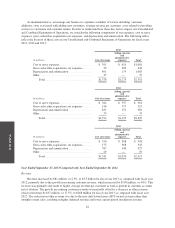
expenses, gross subscriber acquisition cost expenses, and depreciation and amortization. The following tables
reflect the location of these costs in our Consolidated and Combined Statements of Operations for fiscal years
2013, 2012 and 2011:
2013
(in millions) Cost of revenue
Selling, general
and
administrative
expenses Total
Cost to serve expenses ..................... $ 391 $ 610 $1,001
Gross subscriber acquisition cost expenses . . . . . 59 389 448
Depreciation and amortization ............... 891 174 1,065
Other ................................... 37 — 37
Total ............................... $1,378 $1,173 $2,551
2012
(in millions) Cost of revenue
Selling, general
and
administrative
expenses Total
Cost to serve expenses ..................... $ 364 $ 597 $ 961
Gross subscriber acquisition cost expenses . . . . . 146 377 523
Depreciation and amortization ............... 831 151 982
Other ................................... 33 — 33
Total ............................... $1,374 $1,125 $2,499
2011
(in millions) Cost of revenue
Selling, general
and
administrative
expenses Total
Cost to serve expenses ..................... $ 350 $ 568 $ 918
Gross subscriber acquisition cost expenses . . . . . 175 368 543
Depreciation and amortization ............... 787 140 927
Other ................................... 29 — 29
Total ............................... $1,341 $1,076 $2,417
Year Ended September 27, 2013 Compared with Year Ended September 28, 2012
Revenue
Revenue increased by $81 million, or 2.5%, to $3.3 billion for fiscal year 2013 as compared with fiscal year
2012, primarily due to the growth in recurring customer revenue, which increased by $138 million, or 4.8%. This
increase was primarily the result of higher average revenue per customer as well as growth in customer accounts,
net of attrition. The growth in recurring customer revenue was partially offset by a decrease in other revenue,
which went down by $57 million, or 17.5%, to $268 million for fiscal year 2013 as compared with fiscal year
2012. The reduction in other revenue was due to the mix shift toward more ADT-owned systems rather than
outright system sales, resulting in higher deferred revenue and lower current period installation revenue.
42