ADT 2010 Annual Report Download - page 141
Download and view the complete annual report
Please find page 141 of the 2010 ADT annual report below. You can navigate through the pages in the report by either clicking on the pages listed below, or by using the keyword search tool below to find specific information within the annual report.-
 1
1 -
2
-
3
-
4
-
5
-
6
-
7
-
8
-
9
-
10
-
11
-
12
-
13
-
14
-
15
-
16
-
17
-
18
-
19
-
20
-
21
-
22
-
23
-
24
-
25
-
26
-
27
-
28
-
29
-
30
-
31
-
32
-
33
-
34
-
35
-
36
-
37
-
38
-
39
-
40
-
41
-
42
-
43
-
44
-
45
-
46
-
47
-
48
-
49
-
50
-
51
-
52
-
53
-
54
-
55
-
56
-
57
-
58
-
59
-
60
-
61
-
62
-
63
-
64
-
65
-
66
-
67
-
68
-
69
-
70
-
71
-
72
-
73
-
74
-
75
-
76
-
77
-
78
-
79
-
80
-
81
-
82
-
83
-
84
-
85
-
86
-
87
-
88
-
89
-
90
-
91
-
92
-
93
-
94
-
95
-
96
-
97
-
98
-
99
-
100
-
101
-
102
-
103
-
104
-
105
-
106
-
107
-
108
-
109
-
110
-
111
-
112
-
113
-
114
-
115
-
116
-
117
-
118
-
119
-
120
-
121
-
122
-
123
-
124
-
125
-
126
-
127
-
128
-
129
-
130
-
 131
131 -
 132
132 -
 133
133 -
 134
134 -
 135
135 -
 136
136 -
 137
137 -
 138
138 -
 139
139 -
 140
140 -
 141
141 -
 142
142 -
 143
143 -
 144
144 -
 145
145 -
 146
146 -
 147
147 -
 148
148 -
 149
149 -
 150
150 -
 151
151 -
152
-
153
-
154
-
155
-
156
-
157
-
158
-
159
-
160
-
161
-
162
-
163
-
164
-
165
-
166
-
167
-
168
-
169
-
170
-
171
-
172
-
173
-
174
-
175
-
176
-
177
-
178
-
179
-
180
-
181
-
182
-
183
-
184
-
185
-
186
-
187
-
188
-
189
-
190
-
191
-
192
-
193
-
194
-
195
-
196
-
197
-
198
-
199
-
200
-
201
-
202
-
203
-
204
-
205
-
206
-
207
-
208
-
209
-
210
-
211
-
212
-
213
-
214
-
215
-
216
-
217
-
218
-
219
-
220
-
221
-
222
-
223
-
224
-
225
-
226
-
227
-
228
-
229
-
230
-
231
-
232
-
233
-
234
-
235
-
236
-
237
-
238
-
239
-
240
-
241
-
242
-
243
-
244
-
245
-
246
-
247
-
248
-
249
-
250
-
251
-
252
-
253
-
254
-
255
-
256
-
257
-
258
-
259
-
260
-
261
-
262
-
263
-
264
-
265
-
266
-
267
-
268
-
269
-
270
-
271
-
272
-
273
-
274
-
275
-
276
-
277
-
278
-
279
-
280
-
281
-
282
-
283
-
284
-
285
-
286
-
287
-
288
-
289
-
290
-
291
-
292
 |
 |

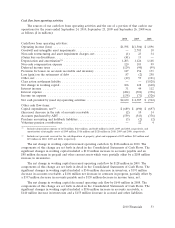
Cash flow from operating activities
The sources of our cash flow from operating activities and the use of a portion of that cash in our
operations for the years ended September 24, 2010, September 25, 2009 and September 26, 2008 were
as follows ($ in millions):
2010 2009 2008
Cash flows from operating activities:
Operating income (loss) ..................................... $1,598 $(1,506) $ 1,896
Goodwill and intangible asset impairments ........................ — 2,705 10
Non-cash restructuring and asset impairment charges, net ............. (1) 23 34
(Gain) loss on divestitures .................................... (41) 13 —
Depreciation and amortization(1) ............................... 1,203 1,126 1,148
Non-cash compensation expense ............................... 120 103 99
Deferred income taxes ...................................... (129) (90) (99)
Provision for losses on accounts receivable and inventory ............. 127 156 133
Loss (gain) on the retirement of debt ........................... 87 (2) 258
Other, net ............................................... (49) 59 (121)
Class action settlement liability ................................ — — (3,020)
Net change in working capital ................................. 106 128 (640)
Interest income ........................................... 31 44 112
Interest expense ........................................... (284) (301) (396)
Income tax expense ........................................ (138) (71) (326)
Net cash provided by (used in) operating activities .................. $2,630 $ 2,387 $ (912)
Other cash flow items:
Capital expenditures, net(2) ................................... $(689) $ (690) $ (697)
(Increase) decrease in the sale of accounts receivable ................ (2) 10 14
Accounts purchased by ADT .................................. (559) (543) (376)
Purchase accounting and holdback liabilities ....................... (3) (2) (2)
Voluntary pension contributions ................................ — 22 4
(1) Includes depreciation expense of $654 million, $610 million, and $620 million in 2010, 2009 and 2008, respectively, and
amortization of intangible assets of $549 million, $516 million and $528 million in 2010, 2009 and 2008, respectively.
(2) Includes net proceeds received for the sale/disposition of property, plant and equipment of $29 million, $12 million and
$25 million in 2010, 2009 and 2008, respectively.
The net change in working capital increased operating cash flow by $106 million in 2010. The
components of this change are set forth in detail in the Consolidated Statements of Cash Flows. The
significant changes in working capital included a $119 million increase in accounts payable and an
$88 million decrease in prepaid and other current assets which were partially offset by a $108 million
increase in inventories.
The net change in working capital increased operating cash flow by $128 million in 2009. The
components of this change are set forth in detail in the Consolidated Statements of Cash Flows. The
significant changes in working capital included a $346 million decrease in inventory, a $191 million
decrease in accounts receivable, a $106 million net decrease in contracts in progress, partially offset by
a $337 million decrease in accounts payable and a $138 million decrease in income taxes, net.
The net change in working capital decreased operating cash flow by $640 million in 2008. The
components of this change are set forth in detail in the Consolidated Statements of Cash Flows. The
significant changes in working capital included a $186 million increase in accounts receivable, a
$140 million increase in inventories and a $155 million decrease in accrued and other liabilities.
2010 Financials 53