ADT 2009 Annual Report Download - page 135
Download and view the complete annual report
Please find page 135 of the 2009 ADT annual report below. You can navigate through the pages in the report by either clicking on the pages listed below, or by using the keyword search tool below to find specific information within the annual report.-
 1
1 -
2
-
3
-
4
-
5
-
6
-
7
-
8
-
9
-
10
-
11
-
12
-
13
-
14
-
15
-
16
-
17
-
18
-
19
-
20
-
21
-
22
-
23
-
24
-
25
-
26
-
27
-
28
-
29
-
30
-
31
-
32
-
33
-
34
-
35
-
36
-
37
-
38
-
39
-
40
-
41
-
42
-
43
-
44
-
45
-
46
-
47
-
48
-
49
-
50
-
51
-
52
-
53
-
54
-
55
-
56
-
57
-
58
-
59
-
60
-
61
-
62
-
63
-
64
-
65
-
66
-
67
-
68
-
69
-
70
-
71
-
72
-
73
-
74
-
75
-
76
-
77
-
78
-
79
-
80
-
81
-
82
-
83
-
84
-
85
-
86
-
87
-
88
-
89
-
90
-
91
-
92
-
93
-
94
-
95
-
96
-
97
-
98
-
99
-
100
-
101
-
102
-
103
-
104
-
105
-
106
-
107
-
108
-
109
-
110
-
111
-
112
-
113
-
114
-
115
-
116
-
117
-
118
-
119
-
120
-
121
-
122
-
123
-
124
-
 125
125 -
 126
126 -
 127
127 -
 128
128 -
 129
129 -
 130
130 -
 131
131 -
 132
132 -
 133
133 -
 134
134 -
 135
135 -
 136
136 -
 137
137 -
 138
138 -
 139
139 -
 140
140 -
 141
141 -
 142
142 -
 143
143 -
 144
144 -
 145
145 -
146
-
147
-
148
-
149
-
150
-
151
-
152
-
153
-
154
-
155
-
156
-
157
-
158
-
159
-
160
-
161
-
162
-
163
-
164
-
165
-
166
-
167
-
168
-
169
-
170
-
171
-
172
-
173
-
174
-
175
-
176
-
177
-
178
-
179
-
180
-
181
-
182
-
183
-
184
-
185
-
186
-
187
-
188
-
189
-
190
-
191
-
192
-
193
-
194
-
195
-
196
-
197
-
198
-
199
-
200
-
201
-
202
-
203
-
204
-
205
-
206
-
207
-
208
-
209
-
210
-
211
-
212
-
213
-
214
-
215
-
216
-
217
-
218
-
219
-
220
-
221
-
222
-
223
-
224
-
225
-
226
-
227
-
228
-
229
-
230
-
231
-
232
-
233
-
234
-
235
-
236
-
237
-
238
-
239
-
240
-
241
-
242
-
243
-
244
-
245
-
246
-
247
-
248
-
249
-
250
-
251
-
252
-
253
-
254
-
255
-
256
-
257
-
258
-
259
-
260
-
261
-
262
-
263
-
264
-
265
-
266
-
267
-
268
-
269
-
270
-
271
-
272
-
273
-
274
-
275
-
276
-
277
-
278
-
279
-
280
-
281
-
282
-
283
-
284
-
285
-
286
-
287
-
288
-
289
-
290
 |
 |

Operating income increased $42 million, or 14.8%, during 2008 as compared to 2007 resulting
largely from increased volume and improved margins, primarily in North America, and to a lesser
extent, Asia and EMEA. The increase in operating income during 2008 was partially offset by
$25 million of restructuring, asset impairment and divestiture charges. Also, operating income was
unfavorably impacted by $9 million due to a goodwill impairment in the Latin America reporting unit.
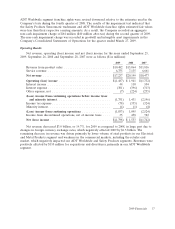
Electrical and Metal Products
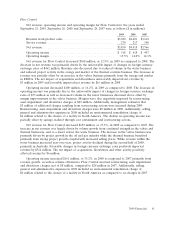
Net revenue, goodwill and intangible asset impairments, operating income and operating margin
for Electrical and Metal Products for the years ended September 25, 2009, September 26, 2008 and
September 28, 2007 were as follows ($ in millions):
2009 2008 2007
Revenue from product sales ............................. $1,389 $2,266 $1,970
Service revenue ......................................364
Net revenue ........................................ $1,392 $2,272 $1,974
Goodwill and intangible asset impairments .................. $ 935 $ — $ —
Operating (loss) income ................................ (940) 342 159
Operating margin ..................................... —
(1) 15.1% 8.1%
(1) Certain operating margins have not been presented as management believes such calculations are not meaningful.
Net revenue for Electrical and Metal Products decreased $880 million, or 38.7%, in 2009 as
compared to 2008. The decrease in revenue was primarily due to lower volume and selling prices of
steel products largely resulting from a decline in the commercial market in North America. Lower
volume and selling prices for armored cable products also contributed to the decline. Changes in
foreign currency exchange rates had an unfavorable impact of $52 million. The net impact of
acquisitions and divestitures negatively affected revenue by approximately $31 million.
Operating income decreased $1.3 billion in 2009 as compared to 2008. Based on the sales volume
decrease as well as the significant decline in the price of steel, the Company recorded a goodwill
impairment charge of $935 million during the second quarter of 2009. There was no goodwill
impairment recorded during 2008. The decrease in operating income also related to volume declines as
well as lower spreads for steel products. Spreads for steel products continued to decline as a direct
result of higher raw material costs and lower selling prices. Lower restructuring and divestiture charges
incurred in 2009 as compared to similar charges incurred in 2008 partially offset the decline in
operating income discussed above. Results for 2009 included restructuring and divestiture charges of
$21 million as compared to $43 million for 2008. Additionally, management estimates that $1 million of
additional charges resulting from restructuring actions were incurred during 2009.
Net revenue for Electrical and Metal Products increased $298 million, or 15.1%, in 2008 as
compared to 2007. The increase in net revenue was largely driven by selling price increases for steel
tubular products and to a lesser extent armored cable products partially offset by decreased sales
volume for both products. Changes in foreign currency exchange rates had a favorable impact of
$44 million.
Operating income increased $183 million, or 115.1%, in 2008 as compared to 2007. The increase in
operating income was primarily due to favorable spreads on both steel tubular and armored cable
products. Income generated by higher selling prices for both steel tubular and armored cable products
were partially offset by decreased sales volume for both products. Operational excellence initiatives
resulted in reductions in production cost rates for both steel tubular and armored cable products. The
increase in operating income during 2008 was partially offset by $43 million of restructuring, asset
impairment and divestiture charges, as compared to $7 million in 2007.
2009 Financials 43