ADT 2003 Annual Report Download - page 68
Download and view the complete annual report
Please find page 68 of the 2003 ADT annual report below. You can navigate through the pages in the report by either clicking on the pages listed below, or by using the keyword search tool below to find specific information within the annual report.-
 1
1 -
2
-
3
-
4
-
5
-
6
-
7
-
8
-
9
-
10
-
11
-
12
-
13
-
14
-
15
-
16
-
17
-
18
-
19
-
20
-
21
-
22
-
23
-
24
-
25
-
26
-
27
-
28
-
29
-
30
-
31
-
32
-
33
-
34
-
35
-
36
-
37
-
38
-
39
-
40
-
41
-
42
-
43
-
44
-
45
-
46
-
47
-
48
-
49
-
50
-
51
-
52
-
53
-
54
-
55
-
56
-
57
-
 58
58 -
 59
59 -
 60
60 -
 61
61 -
 62
62 -
 63
63 -
 64
64 -
 65
65 -
 66
66 -
 67
67 -
 68
68 -
 69
69 -
 70
70 -
 71
71 -
 72
72 -
 73
73 -
 74
74 -
 75
75 -
 76
76 -
 77
77 -
 78
78 -
79
-
80
-
81
-
82
-
83
-
84
-
85
-
86
-
87
-
88
-
89
-
90
-
91
-
92
-
93
-
94
-
95
-
96
-
97
-
98
-
99
-
100
-
101
-
102
-
103
-
104
-
105
-
106
-
107
-
108
-
109
-
110
-
111
-
112
-
113
-
114
-
115
-
116
-
117
-
118
-
119
-
120
-
121
-
122
-
123
-
124
-
125
-
126
-
127
-
128
-
129
-
130
-
131
-
132
 |
 |

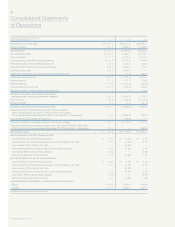
66
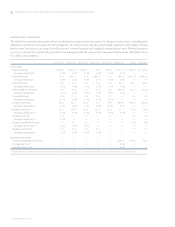
(IN MILLIONS, EXCEPT PER SHARE DATA)
YEAR ENDED SEPTEMBER 30, 2003 2002 2001
Revenue from product sales $29,427.7 $28,741.8 $28,953.1
Service revenue 7,373.6 6,848.0 5,049.0
NET REVENUES 36,801.3 35,589.8 34,002.1
Cost of product sales 19,740.2 19,495.1 18,319.7
Cost of services 4,151.7 3,570.2 2,615.9
Selling, general and administrative expenses 8,813.4 8,181.6 6,745.3
Restructuring and other (credits) charges, net (74.3) 1,124.3 400.4
Charges for the impairment of long-lived assets 824.9 3,309.5 120.1
Goodwill impairment 278.4 1,343.7 —
Write off of purchased in-process research and development —17.8 184.3
OPERATING INCOME (LOSS) 3,067.0 (1,452.4) 5,616.4
Interest income 107.2 117.3 128.3
Interest expense (1,148.0) (1,077.0) (904.8)
Other (expense) income, net (223.4) (216.6) 250.3
Net gain on sale of common shares of a subsidiary —— 24.5
INCOME (LOSS) FROM CONTINUING OPERATIONS
BEFORE INCOME TAXES AND MINORITY INTEREST 1,802.8 (2,628.7) 5,114.7
Income taxes (764.5) (208.1) (1,172.3)
Minority interest (3.6) (1.4) (47.5)
INCOME (LOSS) FROM CONTINUING OPERATIONS 1,034.7 (2,838.2) 3,894.9
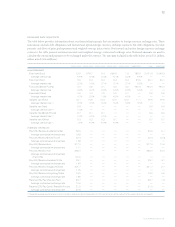
Income (loss) from discontinued operations of Tyco Capital
(net of tax expense of $0, $316.1 million and $195.0 million
for the years ended September 30,2003,2002 and 2001, respectively) 20.0 (6,282.5) 252.5
Loss on sale of Tyco Capital, net of $0 tax —(58.8) —
Income (loss) before cumulative effect of accounting changes 1,054.7 (9,179.5) 4,147.4
Cumulative effect of accounting changes, net of tax benefit of $40.4 million and
$351.9 million for the year ended September 30,2003 and 2001, respectively (75.1) — (683.4)
NET INCOME (LOSS) $«««««979.6 $«(9,179.5) $÷3,464.0
BASIC EARNINGS (LOSS) PER COMMON SHARE:
Income (loss) from continuing operations $÷÷÷«0.52 $÷÷÷(1.43) $÷÷÷«2.16
Income (loss) from discontinued operations of Tyco Capital, net of tax 0.01 (3.16) 0.14
Loss on sale of Tyco Capital, net of tax —(0.03) —
Income (loss) before cumulative effect of accounting changes 0.53 (4.62) 2.30
Cumulative effect of accounting changes (0.04) — (0.38)
Net income (loss) per common share 0.49 (4.62) 1.92
DILUTED EARNINGS (LOSS) PER COMMON SHARE:
Income (loss) from continuing operations $÷÷÷«0.52 $÷÷÷(1.43) $÷÷÷«2.13
Income (loss) from discontinued operations of Tyco Capital, net of tax 0.01 (3.16) 0.14
Loss on sale of Tyco Capital, net of tax —(0.03) —
Income (loss) before cumulative effect of accounting changes 0.53 (4.62) 2.26
Cumulative effect of accounting changes (0.04) — (0.37)
Net income (loss) per common share 0.49 (4.62) 1.89
WEIGHTED-AVERAGE NUMBER OF COMMON SHARES OUTSTANDING:
Basic 1,995.0 1,988.5 1,806.9
Diluted 2,002.7 1,988.5 1,831.6
See Notes to Consolidated Financial Statements.
TYCO INTERNATIONAL LTD.
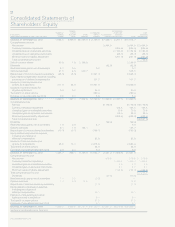
Consolidated Statements
of Operations