3Ware 2000 Annual Report Download - page 3
Download and view the complete annual report
Please find page 3 of the 2000 3Ware annual report below. You can navigate through the pages in the report by either clicking on the pages listed below, or by using the keyword search tool below to find specific information within the annual report.
12000
AMCC
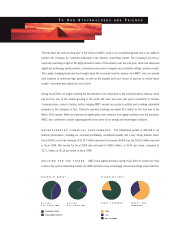
NET REVENUES (IN MILLIONS OF DOLLARS) GROSS MARGIN OPERATING MARGIN
(in millions, except per share data)
FY 97 FY 98 FY 99* FY 00
FOR THE FISCAL YEAR ENDED MARCH
31
Net revenues $ 57.5 $ 76.6 $ 105.0 $ 172.4
Operating income $ 7.0 $ 14.8 $ 23.9 $ 61.1
Net income $ 6.3 $ 15.2 $ 17.1 $ 48.6
Earnings per share—diluted $ 0.09 $ 0.19 $ 0.16 $ 0.41
AT MARCH
31
Cash, cash equivalents & short-term investments $ 13.6 $ 67.9 $ 86.5 $ 954.6
Working capital $ 19.4 $ 77.4 $ 103.6 $ 977.6
Total assets $ 41.8 $ 112.8 $ 150.7 $1,046.9
Total stockholders’ equity $ 27.7 $ 91.6 $ 121.7 $1,013.8
23.8 25.5 27.0 28.7 31.6
37.9
45.8
57.0
0
10
20
30
40
50
60
FISCAL 1999 FISCAL 2000
Q1 Q2 Q3 Q4 Q1 Q2 Q3 Q4
22.0%
25.0%26.0%
18.0%
29.8%
33.9%
37.6% 37.9%
0
10
5
15
25
20
30
35
40
FISCAL 1999 FISCAL 2000
Q1 Q2 Q3 Q4 Q1 Q2 Q3 Q4
**
* Amounts were adversely impacted by the merger-related costs of $2.3 million, net of tax, or $0.02 per diluted share.
** The operating margin for the fourth quarter of fiscal 1999 excluding the merger-related costs of $2.3 million was 27%.
F
INANCIAL
H
IGHLIGHTS
61.0%63.0%64.0%
67.0% 67.5%
70.1%71.1%73.0%
50
55
65
60
70
75
80
FISCAL 1999 FISCAL 2000
Q1 Q2 Q3 Q4 Q1 Q2 Q3 Q4

