Whole Foods 2012 Annual Report Download - page 3
Download and view the complete annual report
Please find page 3 of the 2012 Whole Foods annual report below. You can navigate through the pages in the report by either clicking on the pages listed below, or by using the keyword search tool below to find specific information within the annual report.-
 1
1 -
 2
2 -
 3
3 -
 4
4 -
 5
5 -
 6
6 -
 7
7 -
 8
8 -
 9
9 -
 10
10 -
 11
11 -
 12
12 -
 13
13 -
 14
14 -
15
-
16
-
17
-
18
-
19
-
20
-
21
-
22
-
23
-
24
-
25
-
26
-
27
-
28
-
29
-
30
-
31
-
32
-
33
-
34
-
35
-
36
-
37
-
38
-
39
-
40
-
41
-
42
-
43
-
44
-
45
-
46
-
47
-
48
-
49
-
50
-
51
-
52
-
53
-
54
-
55
-
56
-
57
-
58
-
59
-
60
-
61
-
62
-
63
-
64
-
65
-
66
-
67
-
68
-
69
-
70
-
71
-
72
 |
 |

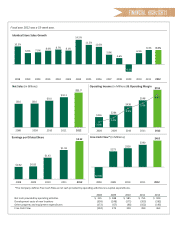
financial highlights
Fiscal year 2012 was a 53-week year.
6.4%
5.4%
1998 1999 2000 2001 2002 2003 2004 2005 2006 2007 2008 2009 2010 2011 2012
2008 2009 2010 2011 2012 2008 2009 2010 2011 2012
2008 2009 2010 2011 2012 2008 2009 2010 2011 2012
10.5%
6.6% 7.0% 8.0% 8.7% 8.1%
14.5%
11.5% 10.3%
5.8%
3.6%
-4.3%
6.5%
8.4% 8.4%
$8.0 $8.0
$9.0
$10.1
$11.7
$236
$284
$438
$548
$744
$273
$328
$390
$463
$(194)
$0.82 $0.85
$1.43
$1.93
$2.52
Net cash provided by operang acvies
Development costs of new locaons
Other property and equipment expenditures
Free Cash Flow
*The Company denes Free Cash Flow as net cash provided by operang acvies less capital expenditures.
3.0%
3.5%
4.9%
Idencal Store Sales Growth
Net Sales (in Billions) Operang Income (in Millions) & Operang Margin
Free Cash Flow* (in Millions)
Earnings per Diluted Share
2008 2009 2010 2011 2012
$ 335 $ 588 $ 585 $ 755 $ 920
(358) (248) (171) (203) (262)
(172) (67) (85) (162) (195)
(194) 273 328 390 463