Whole Foods 2009 Annual Report Download - page 17
Download and view the complete annual report
Please find page 17 of the 2009 Whole Foods annual report below. You can navigate through the pages in the report by either clicking on the pages listed below, or by using the keyword search tool below to find specific information within the annual report.-
 1
1 -
2
-
3
-
4
-
5
-
6
-
 7
7 -
 8
8 -
 9
9 -
 10
10 -
 11
11 -
 12
12 -
 13
13 -
 14
14 -
 15
15 -
 16
16 -
 17
17 -
 18
18 -
 19
19 -
 20
20 -
 21
21 -
 22
22 -
 23
23 -
 24
24 -
 25
25 -
 26
26 -
 27
27 -
28
-
29
-
30
-
31
-
32
-
33
-
34
-
35
-
36
-
37
-
38
-
39
-
40
-
41
-
42
-
43
-
44
-
45
-
46
-
47
-
48
-
49
-
50
-
51
-
52
-
53
-
54
-
55
-
56
-
57
-
58
-
59
-
60
-
61
-
62
-
63
-
64
-
65
-
66
-
67
-
68
-
69
-
70
-
71
-
72
-
73
-
74
-
75
-
76
-
77
-
78
-
79
-
80
-
81
-
82
-
83
-
84
 |
 |

11
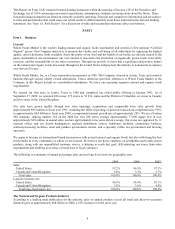
Economic Value Added
We use Economic Value Added (“EVA”™) as a basis for our business decisions and as a component in determining
incentive compensation. In its simplest definition, EVA is equivalent to net operating profits after taxes minus a charge on
the cost of invested capital necessary to generate those profits. We believe one of our core strengths is our decentralized
culture, where many decisions are made at the store level, close to the customer. We believe this is one of our strongest
competitive advantages and that EVA is the best financial framework that team members can use to help make decisions that
create sustainable shareholder value.
We use EVA extensively for capital investment decisions, including evaluating new store real estate decisions and store
remodeling proposals. We only invest in projects that we believe will add long-term value to the Company. The EVA
decision-making model also enhances operating decisions in stores. Our emphasis is on EVA improvement, as we want to
challenge our teams to continue to innovate and grow EVA in new ways. We believe that opportunities always exist to
increase sales and margins, to lower operating expenses and to make investments that add value in ways that benefit all of
our stakeholders. We believe that focusing on EVA improvement encourages continuous improvement of our business.
Approximately 1,000 leaders throughout the Company participate in our incentive compensation plans that incorporate EVA
as a component. These plans cover our senior executive leadership, regional leadership and the store leadership team (store
team leaders and assistant store team leaders) in all stores. A component of incentive compensation for each of these groups
is determined based on relevant EVA measures at different levels, including the total Company level, the regional level, the
store or facility level, and the team level. We believe using EVA in a multi-dimensional approach helps us to measure the
results of decisions made at different levels of the Company. We expect EVA to remain a component of our compensation
structure throughout the Company in the coming years.
Additional information about our EVA financial results is available on our corporate website at www.wholefoodsmarket.com
but is not incorporated by reference into this Form 10-K.
Growth Strategy
Whole Foods Market’s growth strategy is to expand primarily through new store openings. We have a disciplined,
opportunistic real estate strategy, opening stores in existing trade areas as well as new areas, including international
locations. Our new stores typically are located on premium real estate sites and range in size between 35,000 and 50,000
square feet which we believe is appropriate in most circumstances to maximize return on invested capital and EVA, and we
expect the majority of our stores to fall within that range going forward. We have also grown through acquisitions, with
approximately 23% of our existing square footage coming from acquisitions. Because the food retailing industry is highly
fragmented and comprised of many smaller local and regional chains, we may continue to pursue acquisitions of smaller
chains that provide access to desirable areas, locations and experienced team members. Going forward, however, such
acquisitions are not expected to significantly impact our future store growth or financial results due to the size of the
Company’s existing store base.
We have an ongoing relocation strategy and each year relocate some of our smaller stores to larger locations with improved
visibility and parking. For the 22 stores relocated in fiscal years 2005 through 2009, the overall average increase in size was
approximately 124%. Our historical store growth is summarized below:
2009 2008 2007 2006 2005
Stores at beginning of fiscal year 275 276 186 175 163
Stores opened 15 20 21 13 15
Acquired stores - - 109 1 -
Divested stores - - (35) - -
Relocations and closures (6) (21) (5) (3) (3)
Stores at end of fiscal year 284 275 276 186 175
Remodels with major expansions1 2 1 2 1 -
Total gross square footage at end of fiscal year 10,566,000 9,895,000 9,312,000 6,377,000 5,819,000
Year-over-year change 7% 6% 46% 10% 13%
1 Defined as remodels with expansions of square footage greater than 20% completed during the fiscal year.