Whole Foods 2008 Annual Report Download - page 3
Download and view the complete annual report
Please find page 3 of the 2008 Whole Foods annual report below. You can navigate through the pages in the report by either clicking on the pages listed below, or by using the keyword search tool below to find specific information within the annual report.-
 1
1 -
 2
2 -
 3
3 -
 4
4 -
 5
5 -
 6
6 -
 7
7 -
 8
8 -
 9
9 -
 10
10 -
 11
11 -
 12
12 -
 13
13 -
 14
14 -
15
-
16
-
17
-
18
-
19
-
20
-
21
-
22
-
23
-
24
-
25
-
26
-
27
-
28
-
29
-
30
-
31
-
32
-
33
-
34
-
35
-
36
-
37
-
38
-
39
-
40
-
41
-
42
-
43
-
44
-
45
-
46
-
47
-
48
-
49
-
50
-
51
-
52
-
53
-
54
-
55
-
56
-
57
-
58
-
59
-
60
-
61
-
62
-
63
-
64
-
65
-
66
-
67
-
68
-
69
-
70
-
71
-
72
-
73
-
74
-
75
-
76
-
77
-
78
-
79
-
80
-
81
-
82
-
83
-
84
-
85
-
86
-
87
-
88
 |
 |

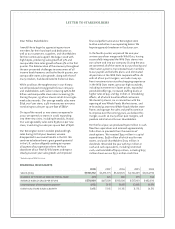
Dear Fellow Stakeholders:
I would like to begin by appreciating our team
members for their hard work and dedication as
well as our customers, suppliers, and shareholders
for their continued support. We began 2008 with
high hopes, producing sales growth of 31% and
comparable store sales growth of over 9% in the first
quarter. The deterioration of the economy throughout
the year presented challenges to consumers of all
income levels however, and by the fourth quarter, our
comparable stores sales growth, along with that of
many retailers, had decelerated to historical lows.
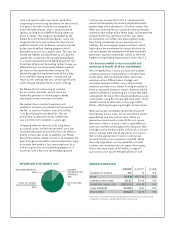
While 2008 was the toughest year in our history,
we still produced strong growth for our company
and stakeholders, with sales increasing 24% to $8
billion and comparable store sales increasing 5%.
During the year, 135 of our stores set all-time single-
week sales records. Our average weekly sales were
$656,000* per store, a 4% increase year over year,
translating to sales per square foot of $882*.
On top of the record 21 new stores we opened in
2007, we opened 20 stores in 2008, expanding
into three new cities, including Honolulu, Hawaii.
Our average weekly sales were $538,000 per new
store, translating to sales per square foot of $528.
Our Kensington store in London produced high
sales during its first year; however, we were
disappointed in our overall results in the U.K. We
continue to believe there is great growth potential
in the U.K. and are diligently seeking to improve
all aspects of our operations there. We have
closed one of our Fresh & Wild stores and expect
steady year-over-year sales growth and improved
financial performance at our Kensington store
to drive a reduction in our operating losses. We
hope to approach breakeven in fiscal year 2011.
In the fourth quarter, we passed the one-year
anniversary of our merger with Wild Oats, having
successfully integrated the Wild Oats stores into
our culture and into our company. During the year,
we converted all of the stores to our purchasing and
information systems; transitioned team members
to our payroll and benefits plans; and eliminated
all positions at the Wild Oats corporate office. As
with all of our past mergers, we made many up-
front investments to raise the shopping experience
in the Wild Oats stores up to our high standards,
including investments in lower prices, expanded
perishable offerings, increased staffing levels at
higher rates of pay, and $33 million in remodeling
efforts, all of which have benefited customers.
We closed 19 stores, six in connection with the
opening of new Whole Foods Market stores, and
re-branded 45 stores to Whole Foods Market store
fronts and signage. As sales and profits continue
to improve over the coming years, we believe this
merger, as with so many of our past mergers, will
produce solid returns for our shareholders.
For the fiscal year, we produced $326 million in cash
flow from operations and received approximately
$18 million in proceeds from the exercise of
stock options. We invested $522 million in capital
expenditures, $358 million of which was for new
stores, and paid shareholders $109 million in
dividends. We ended the year with $31 million in
cash and cash equivalents, including restricted
cash, and total debt of $929 million, including $195
million drawn on our $350 million credit line.
LETTER TO STAKEHOLDERS
FINANCIAL HIGHLIGHTS
2008 2007 2006 2005 2004
SALES (000s)$7,953,912 $6,591,773 $5,607,376 $4,701,289 $3,864,950
NUMBER OF STORES AT END OF FISCAL YEAR 275 276 186 175 163
AVERAGE WEEKLY SALES PER STORE $570,000 $617,000 $593,000 $537,000 $482,000
COMPARABLE STORE SALES GROWTH 4.9% 7.1% 11.0% 12.8% 14.9%
IDENTICAL STORE SALES GROWTH 3.6% 5.8% 10.3% 11.5% 14.5%
* Excludes acquired Wild Oats stores.