Washington Post 2010 Annual Report Download - page 7
Download and view the complete annual report
Please find page 7 of the 2010 Washington Post annual report below. You can navigate through the pages in the report by either clicking on the pages listed below, or by using the keyword search tool below to find specific information within the annual report.-
 1
1 -
 2
2 -
 3
3 -
 4
4 -
 5
5 -
 6
6 -
 7
7 -
 8
8 -
 9
9 -
 10
10 -
 11
11 -
 12
12 -
 13
13 -
 14
14 -
 15
15 -
 16
16 -
 17
17 -
 18
18 -
19
-
20
-
21
-
22
-
23
-
24
-
25
-
26
-
27
-
28
-
29
-
30
-
31
-
32
-
33
-
34
-
35
-
36
-
37
-
38
-
39
-
40
-
41
-
42
-
43
-
44
-
45
-
46
-
47
-
48
-
49
-
50
-
51
-
52
-
53
-
54
-
55
-
56
-
57
-
58
-
59
-
60
-
61
-
62
-
63
-
64
-
65
-
66
-
67
-
68
-
69
-
70
-
71
-
72
-
73
-
74
-
75
-
76
-
77
-
78
-
79
-
80
-
81
-
82
-
83
-
84
-
85
-
86
-
87
-
88
-
89
-
90
-
91
-
92
-
93
-
94
-
95
-
96
-
97
-
98
-
99
-
100
-
101
-
102
-
103
-
104
-
105
-
106
-
107
-
108
-
109
-
110
-
111
-
112
-
113
-
114
-
115
-
116
-
117
-
118
 |
 |

5
2010 ANNUAL REPORT
Also, the tuitions at for-profit colleges are gen-
erally higher than those at state universities
and community colleges. And (say the critics),
aggressive recruiting brings many students to
for-profit colleges who don’t really want to be
there, or don’t understand what they’re signing
up for.
Our reply:
1. For students with our demographics, Kaplan’s
graduation rates are much higher than those
at traditional colleges (indeed, at all colleges,
for-profit or not-for-profit).
2. Poor students have higher debt loads and
are likelier to default because they are poor.
Whether they attend for-profit or not-for-
profit colleges, a student with no family
resources (there are many) will have to bor-
row almost all of the cost of higher educa-
tion. But that student also has much more
at stake. Let’s step away from Kaplan for a
moment and consider another set of stu-
dents. This year, roughly 60% of students
graduating from Washington, DC’s public
schools are so poor that their families will be
expected to contribute nothing to the cost
of their college education. (If you have ever
filled out a federal financial aid form, these
students have an expected family contribu-
tion of zero.) But no students have more at
stake in attending college and graduating.
Failure to attend generally means a life of
very limited job choices. Should such a stu-
dent try college if it means a risk of high
debt and possible default? In most cases, I
would say yes.
3. On tuition: the federal government is an
inadvertent price-fixer in the for-profit edu-
cation field. A simple change would allow
price competition among for-profit colleges.
We would cut tuition for some programs if
we could do so without running afoul of gov-
ernment regulations.
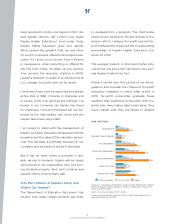
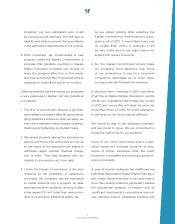
COMPARATIVE GRADUATION RATES BY RISK FACTORS
(2-year or shorter programs)
0%
10%
20%
30%
40%
50%
60%
70%
Kaplan (58%) Public (30%)
6543210
Number of Risk Factors
Graduation Rate
2+ Risk Factor Graduation Rate
National Data Source: National Center for Education Statistics, 2003–04
Beginning Postsecondary Students Longitudinal Study.
Graduation rates include students pursuing associate’s degrees and certificates.
Kaplan Data Source: Kaplan internal data for comparable students, 2003–04.
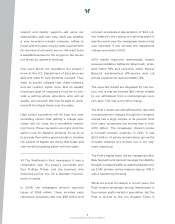
COMPARATIVE GRADUATION RATES BY RISK FACTORS
(Undergraduate Degree Students)
0%
10%
20%
30%
40%
50%
60%
70%
6543210
Kaplan (32%) National (17%)
Number of Risk Factors
Graduation Rate
2+ Risk Factor Graduation Rate
National Data Source: National Center for Education Statistics, 2003–04
Beginning Postsecondary Students Longitudinal Study.
Graduation rates include students pursuing associate’s and bachelor’s degrees.
Kaplan Data Source: Kaplan internal data for comparable students, 2003–04.