Wacom 2015 Annual Report Download - page 7
Download and view the complete annual report
Please find page 7 of the 2015 Wacom annual report below. You can navigate through the pages in the report by either clicking on the pages listed below, or by using the keyword search tool below to find specific information within the annual report.-
 1
1 -
 2
2 -
 3
3 -
 4
4 -
 5
5 -
 6
6 -
 7
7 -
 8
8 -
 9
9 -
 10
10 -
 11
11 -
 12
12 -
 13
13 -
 14
14 -
 15
15 -
 16
16 -
 17
17 -
 18
18 -
19
-
20
-
21
-
22
-
23
-
24
-
25
-
26
-
27
-
28
-
29
-
30
-
31
-
32
-
33
-
34
-
35
-
36
-
37
-
38
-
39
-
40
-
41
-
42
-
43
-
44
-
45
 |
 |

All Rights Reserved. Copyright © 2015 Wacom Co., Ltd. 7
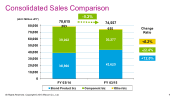
Consolidated Sales Comparison
(Unit: Million JPY)
38,960 43,625
39,002 30,277
653 655
0
10,000
20,000
30,000
40,000
50,000
60,000
70,000
80,000
FY 03/14 FY 03/15
Brand Product biz Component biz Other biz
+0.2%
+12.0%
-22.4%
-5.2%
78,615 74,557
Change
Ratio