Wacom 2012 Annual Report Download - page 11
Download and view the complete annual report
Please find page 11 of the 2012 Wacom annual report below. You can navigate through the pages in the report by either clicking on the pages listed below, or by using the keyword search tool below to find specific information within the annual report.-
 1
1 -
 2
2 -
 3
3 -
 4
4 -
 5
5 -
 6
6 -
 7
7 -
 8
8 -
 9
9 -
 10
10 -
 11
11 -
 12
12 -
 13
13 -
 14
14 -
 15
15 -
 16
16 -
 17
17 -
 18
18 -
 19
19 -
 20
20 -
 21
21 -
 22
22 -
23
-
24
 |
 |

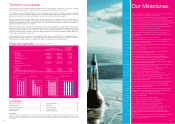
15,667
17,896
’08 ’09 ’10
(Millions of yen)
0
5,000
10,000
15,000
20,000
25,000
35,000
40,000
30,000
’11 ’12 ’08 ’09 ’10 ’11 ’08 ’09 ’10
(Millions of yen) (%) (Millions of yen) (%)
0
5,000
10,000
15,000
20,000
35
40
45
50
55
’12
0
1,000
2,000 10
3,000
4,000
6,000
5,000
0
5
15
20
30
25
’11
(For the year’s ended March 31) (For the year’s ended March 31) (For the year’s ended March 31)
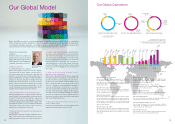
Net sales
Operating income/Operating margin
Gross profit/Gross profit margin
Five-Year Summary
Wacom Co., Ltd. and Its Subsidiaries
33,075
40,706
36,739
33,809
32,045
9.9
3,284
’12
4,067
10.0
47.4
44.0
16,761
15,668
18,640
50.7
49.6 48.9 4,311
5,539
15.1
12.8
9.8
3,128
For the year:
Net sales
Gross profit
Operating income
Income before income taxes
Net income
Comprehensive income
At year end:
Cash and cash equivalents
Total net assets
Total assets
Net income per share
Basic
Diluted
Equity ratio(%)
Return on equity (%)
Number of employees
$495,262
217,739
49,489
42,639
26,540
24,423
$145,637
415,250
230,173
$66.48
66.42
Five-Year Summary
Note 1: U.S. dollar amounts have been translated from yen, for convenience only, at the rate of ¥82.19=U.S. $1, the approximate exchange rate prevailing on March 31, 2012.
Note 2: Repurchase of 20,000 own shares for 1.85BJPY in 2009. 3 F.Y. and 5,000 own shares for 0.44BJPY in 2012. 3 F. Y.
Note 3: The figures in 2011. 3 F. Y. were recalculated retroactively because of the adoption of the new accounting principles in revenue recognition.
Note 4: The tablet business was reorganized into three categories of Professional Products, Consumer Products, and “Business Products” by use in in 2012. 3. F. Y.
Thousands of
U.S. dollars
Year ended
March 31
2012
¥36,739,196
18,640,355
5,538,871
5,564,082
3,501,360
-
¥13,577,194
18,516,742
29,221,330
¥8,348.74
8,304.38
63.5
20.1
584
¥33,809,138
16,761,164
4,311,378
4,179,661
2,579,025
-
¥11,014,114
17,796,487
25,631,057
¥6,213.93
6,197.78
69.4
14.2
637
¥32,044,578
15,668,147
3,127,822
3,120,867
1,968,406
-
¥12,350,113
18,269,590
28,199,429
¥4,899.57
4,888.56
64.8
10.9
702
¥40,705,578
17,895,936
4,067,475
3,504,537
2,181,341
2,007,351
¥11,969,873
34,129,398
18,917,895
¥5,463.95
5,458.66
55.2
11.7
785
Thousands of yen
Year ended March 31
2008 2010 2012
¥33,030,359
15,634,445
3,252,086
2,952,508
1,967,083
1,408,053
¥10,454,820
27,093,503
18,481,946
¥4,895.48
4,885.72
68.1
10.7
747
20112009
20
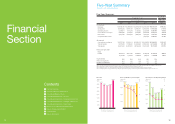
Five-Year Summary
Overview of Business Performance
Consolidated Balance Sheets
Consolidated Statements of Income
Consolidated Statements of Comprehensive Income
20
21
24
26
27
Consolidated Statements of Changes in Net Assets
Consolidated Statements of Cash Flows
Notes to Consolidated Financial Statements
Report of Independent Auditors
28
29
30
44
Corporate data
45
Investor Information
46
Contents
Financial
Section
19