Vectren 2010 Annual Report Download - page 5
Download and view the complete annual report
Please find page 5 of the 2010 Vectren annual report below. You can navigate through the pages in the report by either clicking on the pages listed below, or by using the keyword search tool below to find specific information within the annual report.-
 1
1 -
 2
2 -
 3
3 -
 4
4 -
 5
5 -
 6
6 -
 7
7 -
 8
8 -
 9
9 -
 10
10 -
 11
11 -
 12
12 -
 13
13 -
 14
14 -
 15
15 -
 16
16 -
17
-
18
-
19
-
20
-
21
-
22
-
23
-
24
-
25
-
26
-
27
-
28
-
29
-
30
-
31
-
32
-
33
-
34
-
35
-
36
-
37
-
38
-
39
-
40
-
41
-
42
-
43
-
44
-
45
-
46
-
47
-
48
-
49
-
50
-
51
-
52
-
53
-
54
-
55
-
56
-
57
-
58
-
59
-
60
-
61
-
62
-
63
-
64
-
65
-
66
-
67
-
68
-
69
-
70
-
71
-
72
-
73
-
74
-
75
-
76
-
77
-
78
-
79
-
80
-
81
-
82
-
83
-
84
-
85
-
86
-
87
-
88
-
89
-
90
-
91
-
92
-
93
-
94
-
95
-
96
-
97
-
98
-
99
-
100
-
101
-
102
-
103
-
104
-
105
-
106
-
107
-
108
-
109
-
110
-
111
-
112
-
113
-
114
-
115
-
116
-
117
-
118
-
119
-
120
-
121
-
122
-
123
-
124
-
125
-
126
-
127
-
128
 |
 |

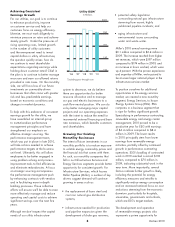
Achieving Consistent
Earnings Growth
For our utilities, our goal is to continue
to enhance productivity, improve
on customer service and help our
customers focus on energy efficiency.
Likewise, we must work diligently to
minimize pressure on rates and achieve
steady growth. Under the pressures of
rising operating costs, limited growth
in the number of utility customers
and the ever-present need to invest
capital dollars in utility infrastructure,
the question quickly arises: how do
we continue to meet shareholder
expectations regarding earnings while
holding down customer rates? Chief in
the plan is to continue to better manage
resources and earn our allowed returns
provided in rate cases. On the nonutility
side, we will focus less of our future
investments on commodity-driven
businesses that often come with greater
risk and less predictable earnings
based on economic conditions and
changes in market dynamics.
To help with this endeavor of consistent
earnings growth for the utility, we
have assembled an internal group
to institutionalize performance
management principles and have
strengthened our emphasis on
effective strategic sourcing. The
performance management team,
which was put in place in late 2010,
will take actions needed to achieve
performance targets at the business
unit level. Ultimately, this will allow
employees to be better engaged in
using problem-solving and process-
improvement tools to find efficiencies
and eliminate redundancies. A focus
on strategic sourcing accompanies
the performance management push
by enhancing contracts with vendors
and in facilitating more in-depth
bidding processes. These collective
efforts will ensure we’ll be able to even
more effectively manage and reduce
operating and capital costs to achieve
significant savings over the next five
years.
Although we don’t expect the capital
needs of our utility infrastructure
system to decrease, we do believe
there are opportunities for better
resource allocation and to manage
our gas and electric businesses to a
cash flow neutral position. We can do
so by better managing major capital
projects and our operating expenses
with the intent to reduce the need for
incremental external financing and base
rate increases, which benefits customers
and shareholders.
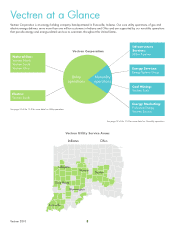
Growing Our Existing
Nonutility Businesses
The intent of future investments in our
nonutility portfolio is to reduce exposure
to volatile energy commodity prices and
the financial risk that comes with them.
As such, our nonutility companies that
fall in our Infrastructure Services and
Energy Services segments provide better
opportunity for consistent growth. For
Infrastructure Services, which houses
Miller Pipeline (Miller), a number of key
drivers suggest demand will continue
growing in areas such as:
• the replacement of bare steel and
cast iron natural gas distribution
systems;
• infrastructure needed for production
and pipeline expansion given the
development of shale gas reserves;
• potential safety legislation
surrounding natural gas infrastructure
stemming from recent, highly
publicized pipeline incidents; and
• aging infrastructure and
environmental issues surrounding
water and waste water.
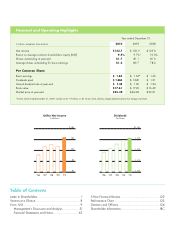
Miller’s 2010 annual earnings were
$3.1 million compared to $2.4 million in
2009. The increase resulted from higher
net revenues, which were $197 million
compared to $174 million in 2009, and
an increase in hours worked, which were
up 4 percent. With the proven experience
and expertise of Miller, we’re poised to
be an even larger national player in the
infrastructure services market.
To position ourselves for additional
opportunities in the energy services
market, we created a new nonutility
segment, Energy Services, to house
Energy Systems Group (ESG). ESG
competes in a business segment that
is ripe for further, significant growth.
Specializing in performance contracting,
renewable energy and energy center
management, 2010 proved to be a
productive year for ESG with earnings
of $6.4 million compared to $8.4
million in 2009. The lower results
in 2010 principally stem from lower
earnings from renewable energy
activities, partially offset by continued
growth in performance contracting
operations. ESG’s backlog of contracted
work in 2010 reached a record $118
million, compared to $70 million in
2009, indicating substantial work in the
near term. More importantly, several
factors indicate further growth is likely,
including the potential for energy
efficiency measures and retrofits to
significantly reduce energy consumption
and an increased national focus on cost
reductions stemming from the economic
downturn, particularly for hospitals,
universities, governments and schools,
which are ESG’s target markets.
The development and operation
of renewable energy projects also
represents a prime opportunity for
Vectren 2010
3
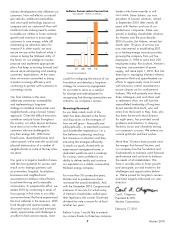
$300
250
200
150
100
Utility O&M*
In Millions
‘06 ‘07 ‘08 ‘09 ‘10
*Excluding pass-through costs