Toshiba 1997 Annual Report Download - page 3
Download and view the complete annual report
Please find page 3 of the 1997 Toshiba annual report below. You can navigate through the pages in the report by either clicking on the pages listed below, or by using the keyword search tool below to find specific information within the annual report.-
 1
1 -
 2
2 -
 3
3 -
 4
4 -
 5
5 -
 6
6 -
 7
7 -
 8
8 -
 9
9 -
 10
10 -
 11
11 -
 12
12 -
 13
13 -
 14
14 -
15
-
16
-
17
-
18
-
19
-
20
-
21
-
22
-
23
-
24
-
25
-
26
-
27
-
28
-
29
-
30
-
31
-
32
-
33
-
34
-
35
-
36
-
37
-
38
-
39
-
40
-
41
-
42
-
43
-
44
-
45
-
46
-
47
-
48
-
49
-
50
-
51
 |
 |

1.
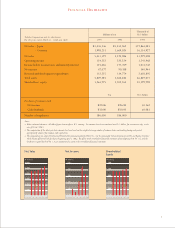
Thousands of
Millions of yen U.S. dollars
1997 1996 1997
Net sales – Japan ¥3,455,146 ¥3,451,062 $27,864,081
– Overseas 1,998,251 1,669,024 16,114,927
Net sales 5,453,397 5,120,086 43,979,008
Operating income 154,252 220,224 1,243,968
Income before income taxes and minority interest 125,456 177,749 1,011,742
Net income 67,077 90,388 540,944
Research and development expenditures 332,555 314,774 2,681,895
Total assets 5,809,285 5,560,484 46,849,073
Shareholders’ equity 1,264,775 1,202,265 10,199,798
Yen U.S. dollars
Per share of common stock:
Net income ¥20.06 ¥26.85 $0.162
Cash dividends ¥10.00 ¥10.00 $0.081
Number of employees 186,000 186,000
Notes:
1. Unless indicated otherwise, all dollar figures herein refer to U.S. currency. Yen amounts have been translated into U.S. dollars, for convenience only, at the
rate of ¥124=US$1.
2. The computation of the above per share amounts has been based on the weighted-average number of common shares outstanding during each period,
appropriately adjusted for common stock equivalents.
3. The company has not adopted Statement of Financial Accounting Standards (SFAS) No. 115 “Accounting for Certain Investments in Debt and Equity Securities”
which became effective for the fiscal year beginning April 1, 1994. The effects on the consolidated financial statements of not adopting SFAS No. 115 and the
disclosures required by SFAS No. 115 are summarized in a note to the consolidated financial statements.
Financial Highlights
Toshiba Corporation and its subsidiaries
For the years ended March 31, 1997 and 1996
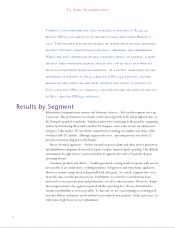
93March
0
1,000
2,000
3,000
4,000
5,000
6,000
94 95 96 97
(¥ billion)
93March
0
20
40
60
80
100
94 95 96 97
(¥ billion)
93March
0
300
600
900
1,200
1,500
94 95 96 97
(¥ billion)
Net Sales Net Income Shareholders’
Equity