TomTom 2011 Annual Report Download - page 85
Download and view the complete annual report
Please find page 85 of the 2011 TomTom annual report below. You can navigate through the pages in the report by either clicking on the pages listed below, or by using the keyword search tool below to find specific information within the annual report.-
 1
1 -
2
-
3
-
4
-
5
-
6
-
7
-
8
-
9
-
10
-
11
-
12
-
13
-
14
-
15
-
16
-
17
-
18
-
19
-
20
-
21
-
22
-
23
-
24
-
25
-
26
-
27
-
28
-
29
-
30
-
31
-
32
-
33
-
34
-
35
-
36
-
37
-
38
-
39
-
40
-
41
-
42
-
43
-
44
-
45
-
46
-
47
-
48
-
49
-
50
-
51
-
52
-
53
-
54
-
55
-
56
-
57
-
58
-
59
-
60
-
61
-
62
-
63
-
64
-
65
-
66
-
67
-
68
-
69
-
70
-
71
-
72
-
73
-
74
-
 75
75 -
 76
76 -
 77
77 -
 78
78 -
 79
79 -
 80
80 -
 81
81 -
 82
82 -
 83
83 -
 84
84 -
 85
85 -
 86
86 -
 87
87 -
 88
88
 |
 |

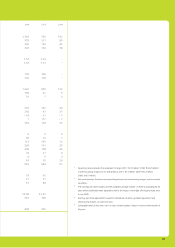
83
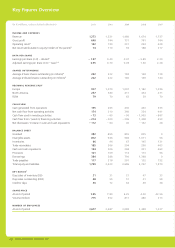
1 Operating results excludes the impairment charges (2011: €512 million; 2008: €1,047 million)
and restructuring charges (2011: €14.8 million; 2010: €3.3 million; 2009: €10.3 million;
2008: €16.5 million).
2 Net result excludes the above mentioned impairment and restructuring charges and the related
tax effects.
3 The earnings per share number and the weighted average number of shares outstanding for all
years before 2009 have been adjusted to refl ect the impact of the right offering that took place
in July 2009.
4 Earnings per share adjusted for acquisition related amortisation, goodwill impairment and
restructuring charges on a post tax basis.
5 Calculated based on the sales / cost of sales and the number of days in the last three months of
the year.
2006 2005 2004
1,364 720 192
579 311 85
340 195 43
222 143 28
1.57 1.04 –
1.63 1.13 –
133 126 –
142 138 –
1,226 670 192
106 42 0
31 7 0
392 102 44
292 43 37
– 29 – 21 – 3
1 117 – 1
264 138 33
0 0 0
39 16 1
123 103 13
266 151 29
438 178 40
44 21 0
0 0 0
67 55 26
903 464 91
57 92
71 77
31 49
27.04 23.97
232 100
809 435