TomTom 2005 Annual Report Download - page 42
Download and view the complete annual report
Please find page 42 of the 2005 TomTom annual report below. You can navigate through the pages in the report by either clicking on the pages listed below, or by using the keyword search tool below to find specific information within the annual report.-
 1
1 -
2
-
3
-
4
-
5
-
6
-
7
-
8
-
9
-
10
-
11
-
12
-
13
-
14
-
15
-
16
-
17
-
18
-
19
-
20
-
21
-
22
-
23
-
24
-
25
-
26
-
27
-
28
-
29
-
30
-
31
-
 32
32 -
 33
33 -
 34
34 -
 35
35 -
 36
36 -
 37
37 -
 38
38 -
 39
39 -
 40
40 -
 41
41 -
 42
42 -
 43
43 -
 44
44 -
 45
45 -
 46
46 -
 47
47 -
 48
48 -
 49
49 -
 50
50 -
 51
51 -
 52
52 -
53
-
54
-
55
-
56
-
57
-
58
-
59
-
60
-
61
-
62
-
63
-
64
-
65
-
66
-
67
-
68
-
69
-
70
-
71
-
72
-
73
-
74
-
75
-
76
-
77
-
78
-
79
-
80
-
81
-
82
-
83
-
84
-
85
-
86
-
87
-
88
-
89
-
90
-
91
-
92
 |
 |

42
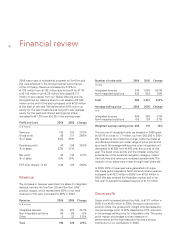
Financialreview
2005wasayearofsubstantialprogressforTomTomand
thiswasreflectedinthestrongfinancialperformance
oftheCompany.Revenueincreasedby275%to
720millionfrom
192millionandnetprofitby411%
to
143millionfrom
28million.Weraised
117
millionofnewcapitalfromourGlobalOfferingandwe
strengthenedourbalancesheettonetassetsof
306
millionattheendoftheyearcomparedwith
38million
atthestartoftheyear.Wedeliveredan83%returnon
equityfortheyear(measuredasnetprofitoveraverage
equityfortheyear)anddilutedearningspershare
increasedto
1.26from
0.26inthepreviousyear.
ProfitandLoss 2004 2005 Change
(in
millions)
Revenue 192 720 275%
Grossprofit 85 311 266%
%ofsales 44% 43%
Operatingprofit 43 195 353%
%ofsales 22% 27%
Netprofit 28 143 411%
%ofsales 15% 20%
EPS(fullydiluted-in
) 0.26 1.26 385%
Revenue
Theincreaseinrevenuewasdrivenbysalesofintegrated
devices,namelytheTomTomGOandTomTom
ONE
productranges,whichrepresented86%ofourtotal
revenuefortheyear,comparedto60%in2004.
Revenue 2004 2005 Change
(in
millions)
Integrateddevices 115 622 441%
Non-Integratedsolutions 69 65 -6%
Other 8 33 313%
Total 192 720 275%
Numberofunitssold 2004 2005 Change
(in000s)
Integrateddevices 248 1,688 581%
Non-Integratedsolutions 438 524 20%
Total 686 2,212 222%
Averagesellingprice 2004 2005 Change
(in
)
Integrateddevices 464 368 -21%
Non-Integratedsolutions 158 124 -21%
Weightedaveragesellingprice 268 311 16%
Thevolumeofintegratedunitsweshippedin2005grew
by581%tocloseto1.7million,upfrom248,000in2004.
Weopenedupthemarkettoalargerconsumerbaseas
weofferedproductsatawiderrangeofpricepointsand
asaresulttheaveragesellingpriceofanintegratedunit
decreasedto
368from
466overthecourseofthe
year.Thelowerpricepointsandthebroaderconsumer
acceptanceofthepersonalnavigationcategorymeant
thatvolumesandrevenuesincreasedsubstantially.The
majorityofoursalesweremadethroughretailchannels.
In2005,93%ofrevenuesweregeneratedinEurope.
WemadegoodprogressinNorthAmericawhererevenue
increasedto
42.3millionin2005from
5.6millionin
2004.WealsoenteredtheAustralianmarketandinour
firstyearofoperationsrealisedrevenueof
7.3million.
Grossprofit
Grossprofitincreasedalmostfourfold,to
311millionin
2005from
85millionin2004.Owingtoreductionsin
productcosts,thegrossprofitmarginonlydecreasedby
onepercentagepointto43%despitethe21%reduction
intheaveragesellingpriceforintegratedunits.Thegross
profitmarginpercentageisakeymeasureof
performanceforthebusinessandthiswasastrong
contributortoourprofitabilityin2005.