Taco Bell 2007 Annual Report Download - page 38
Download and view the complete annual report
Please find page 38 of the 2007 Taco Bell annual report below. You can navigate through the pages in the report by either clicking on the pages listed below, or by using the keyword search tool below to find specific information within the annual report.-
 1
1 -
2
-
3
-
4
-
5
-
6
-
7
-
8
-
9
-
10
-
11
-
12
-
13
-
14
-
15
-
16
-
17
-
18
-
19
-
20
-
21
-
22
-
23
-
24
-
25
-
26
-
27
-
 28
28 -
 29
29 -
 30
30 -
 31
31 -
 32
32 -
 33
33 -
 34
34 -
 35
35 -
 36
36 -
 37
37 -
 38
38 -
 39
39 -
 40
40 -
 41
41 -
 42
42 -
 43
43 -
 44
44 -
 45
45 -
 46
46 -
 47
47 -
 48
48 -
49
-
50
-
51
-
52
-
53
-
54
-
55
-
56
-
57
-
58
-
59
-
60
-
61
-
62
-
63
-
64
-
65
-
66
-
67
-
68
-
69
-
70
-
71
-
72
-
73
-
74
-
75
-
76
-
77
-
78
-
79
-
80
-
81
-
82
-
83
-
84
-
85
-
86
 |
 |

42 YUM! BRANDS, INC.
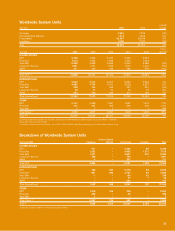
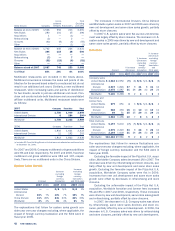
Uncon- Total
solidated Excluding
China Division Company Affiliates Franchisees Licensees
Balance at end of 2005 1,526 552 213 2,291
New Builds 280 101 15 396
Acquisitions 1 — (1) —
Refranchising (2) — 2 —
Closures (43) (8) (4) (55)
Other — — (1) (1)
Balance at end of 2006 1,762 645 224 2,631
New Builds 364 114 28 506
Acquisitions ————
Refranchising (7) — 7 —
Closures (32) (13) (6) (51)
Other ————
Balance at end of 2007 2,087 746 253 3,086
% of Total 68% 24% 8% 100%
Multibrand restaurants are included in the totals above.
Multibrand conversions increase the sales and points of dis-
tribution for the second brand added to a restaurant but do not
result in an additional unit count. Similarly, a new multibrand
restaurant, while increasing sales and points of distribution
for two brands, results in just one additional unit count. Fran-
chise unit counts include both franchisee and unconsolidated
affiliate multibrand units. Multibrand restaurant totals were
as follows:
2007 Company Franchise Total
United States 1,750 1,949 3,699
International Division 6 284 290(a)
Worldwide 1,756 2,233 3,989
2006 Company Franchise Total
United States 1,802 1,631 3,433
International Division 11 192 203
Worldwide 1,813 1,823 3,636
(a) Includes 53 Pizza Hut Wing Street units that were not reflected as multibrand units
at December 30, 2006.
For 2007 and 2006, Company multibrand unit gross additions
were 86 and 212, respectively. For 2007 and 2006, franchise
multibrand unit gross additions were 283 and 197, respec-
tively. There are no multibrand units in the China Division.
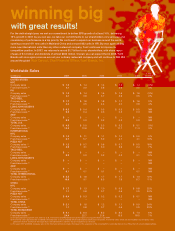
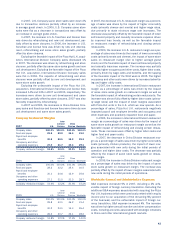
System Sales Growth
Increase
Increase excluding
excluding foreign
foreign currency
currency translation
Increase translation and 53rd week
2007 2006 2007 2006 2007 2006
United States ——N/A N/A N/A 1%
International
Division 15% 7% 10% 7% 10% 9%
China Division 31% 26% 24% 23% 24% 23%
Worldwide 8% 4% 6% 4% 6% 5%
The explanations that follow for system sales growth con-
sider year over year changes excluding, where applicable, the
impact of foreign currency translation and the 53rd week in
fiscal year 2005.
The increases in International Division, China Division
and Worldwide system sales in 2007 and 2006 were driven by
new unit development and same store sales growth, partially
offset by store closures.
In 2007 U.S. system sales were flat as new unit develop-
ment was largely offset by store closures. The increase in U.S.
system sales in 2006 was driven by new unit development and
same store sales growth, partially offset by store closures.
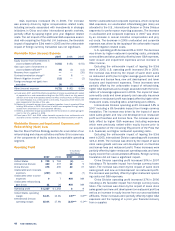
Revenues
% Increase
(Decrease)
% Increase excluding
(Decrease) foreign
excluding currency
foreign translation
% Increase currency and
Amount (Decrease) translation 53rd week
2007 2006 2007 2006 2007 2006 2007 2006
Company sales
United States $ 4,518 $ 4,952 (9) (6) N/A N/A N/A (5)
International
Division 2,507 1,826 37 931 831 10
China Division 2,075 1,587 31 26 24 23 24 23
Worldwide 9,100 8,365 926162
Franchise and
license fees
United States 679 651 43N/A N/A N/A 4
International
Division 568 494 15 10 10 10 10 11
China Division 69 51 35 25 29 21 29 21
Worldwide 1,316 1,196 10 78688
Total revenues
United States 5,197 5,603 (7) (5) N/A N/A N/A (4)
International
Division 3,075 2,320 33 926 926 10
China Division 2,144 1,638 31 26 24 23 24 23
Worldwide $10,416 $9,561 926263
The explanations that follow for revenue fluctuations con-
sider year-over-year changes excluding, where applicable, the
impact of foreign currency translation and the 53rd week in
fiscal year 2005.
Excluding the favorable impact of the Pizza Hut U.K. acqui-
sition, Worldwide Company sales decreased 1% in 2007. The
decrease was driven by refranchising and store closures, par-
tially offset by new unit development and same store sales
growth. Excluding the favorable impact of the Pizza Hut U.K.
acquisition, Worldwide Company sales were flat in 2006.
Increases from new unit development and same store sales
growth were offset by decreases in refranchising and store
closures.
Excluding the unfavorable impact of the Pizza Hut U.K.
acquisition, Worldwide franchise and license fees increased
9% and 8% in 2007 and 2006, respectively. These increases
were driven by new unit development, same store sales growth
and refranchising, partially offset by store closures.
In 2007, the decrease in U.S. Company sales was driven
by refranchising, same store sales declines and store clo-
sures, partially offset by new unit development. In 2006, the
decrease in U.S. Company sales was driven by refranchising
and store closures, partially offset by new unit development.