TJ Maxx 2006 Annual Report Download - page 5
Download and view the complete annual report
Please find page 5 of the 2006 TJ Maxx annual report below. You can navigate through the pages in the report by either clicking on the pages listed below, or by using the keyword search tool below to find specific information within the annual report.-
 1
1 -
 2
2 -
 3
3 -
 4
4 -
 5
5 -
 6
6 -
 7
7 -
 8
8 -
 9
9 -
 10
10 -
 11
11 -
 12
12 -
 13
13 -
 14
14 -
 15
15 -
 16
16 -
17
-
18
-
19
-
20
-
21
-
22
-
23
-
24
-
25
-
26
-
27
-
28
-
29
-
30
-
31
-
32
-
33
-
34
-
35
-
36
-
37
-
38
-
39
-
40
-
41
-
42
-
43
-
44
-
45
-
46
-
47
-
48
-
49
-
50
-
51
-
52
-
53
-
54
-
55
-
56
-
57
-
58
-
59
-
60
-
61
-
62
-
63
-
64
-
65
-
66
-
67
-
68
-
69
-
70
-
71
-
72
-
73
-
74
-
75
-
76
-
77
-
78
-
79
-
80
-
81
-
82
-
83
-
84
-
85
-
86
-
87
-
88
-
89
-
90
-
91
-
92
-
93
-
94
-
95
-
96
-
97
-
98
-
99
-
100
 |
 |

TO OUR FELLOW SHAREHOLDERS:
The year 2006 was pivotal for The TJX Companies. As
both of us came back into the leadership of the busi-
ness in the fall of 2005, we established profitable sales
growth as our top priority. We are pleased with how
our organization responded and the very strong
results we delivered in a relatively short period of time.
With a renewed focus on the fundamentals, and bet-
ter off-price buying being key, we improved execution
across the board. We regained our entrepreneurial
energy and were better risk-takers. We also rein-
forced the meaning of being accountable and results-
driven. We believe that all of these efforts led to our
success in achieving profitable sales growth in 2006.
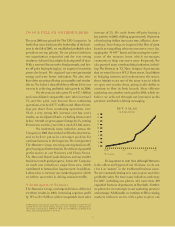
For the year, net sales grew 9% to $17.4 billion
and consolidated comparable store sales increased
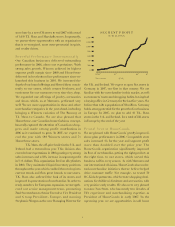
4% over the prior year. Income from continuing
operations reached $777 million and diluted earn-
ings per share from continuing operations were
$1.63, a very strong 26% increase over last year’s
results, on an adjusted basis, excluding items noted
below.*Overall, we grew square footage by 4%, netting
85 stores to end the year with a total of 2,466 stores.
We undertook many initiatives across the
Company in 2006 that worked well in the short term,
and we believe put us in a stronger position for
continued success in the long term. We reinvigorated
The Marmaxx Group, renewing our emphasis on off-
price buying and better brands. We delivered powerful
performance at our Winners and HomeSense,
T.K. Maxx and HomeGoods divisions, and our smaller
businesses made good progress. Across the Company,
we made cost reduction a major focus area, which
contributed to bottom-line improvement. In addition,
it allowed us to increase our marketing spend, which
we believe succeeded in driving customer traffic.
A Reinvigorated Marmaxx
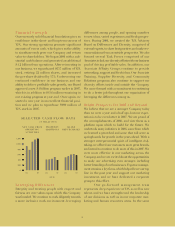
The Marmaxx Group, our largest division, delivered
excellent results in 2006, increasing segment profit
by 10% to $1.1 billion, with a comparable store sales
increase of 2%. We made better off-price buying a
key priority in 2006, shifting approximately 10 percent
of our buying dollars into more true, off-price, close-
out buys. In so doing, we improved the flow of great
brands at compelling values to our stores, every day,
upping the “WOW” factor and increasing the excite-
ment of the treasure hunt, which encourages
customers to shop our stores more frequently. We
also pursued many merchandising initiatives, includ-
ing The Runway at T.J. Maxx designer departments
that we tested in over 40 T.J. Maxx stores. In addition
to bringing newness and excitement to the stores,
these initiatives are one of the many ways in which
we open new vendor doors, giving us the ability to
continue to flow in fresh brands. More effective
marketing was another main goal in 2006, which we
believe we achieved through our increased media
presence and harder-hitting messaging.
It’s important to note that, although Marmaxx
is the oldest and largest of our divisions, we do not
view it as “mature” in the traditional business sense.
We are constantly testing new ways to grow and drive
profitable sales. We have many initiatives underway
for 2007, including our plan to add more than 200
expanded footwear departments at Marshalls. Further,
we plan to be even stronger in our marketing presence
and message. Additionally, we continue to fill in existing
markets with new stores, with a plan to grow our
3
*FY06 adjusted earnings per share from continuing operations exclude the net
benefit of one-time items totaling $.12 per share, detailed in Management's
Discussion and Analysis in FY07 Form 10-K. On a GAAP basis, including these
items, such earnings per share were $1.41.
NET SALES
($ BILLIONS)
82*83*91*02*07
* Recessions (FYE)
18
6
4
0
2
8
10
12
16
14