Stein Mart 2010 Annual Report Download - page 14
Download and view the complete annual report
Please find page 14 of the 2010 Stein Mart annual report below. You can navigate through the pages in the report by either clicking on the pages listed below, or by using the keyword search tool below to find specific information within the annual report.-
 1
1 -
2
-
3
-
 4
4 -
 5
5 -
 6
6 -
 7
7 -
 8
8 -
 9
9 -
 10
10 -
 11
11 -
 12
12 -
 13
13 -
 14
14 -
 15
15 -
 16
16 -
 17
17 -
 18
18 -
 19
19 -
 20
20 -
 21
21 -
 22
22 -
 23
23 -
 24
24 -
25
-
26
-
27
-
28
-
29
-
30
-
31
-
32
-
33
-
34
-
35
-
36
-
37
-
38
-
39
-
40
-
41
-
42
-
43
-
44
-
45
-
46
-
47
-
48
 |
 |

12
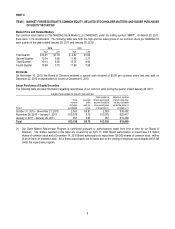
charges, a cumulative breakage gain, net of a charge associated with changing our physical inventory process and the (reversal)/initial recording of a valuation
allowance for deferred tax assets, may provide a more meaningful measure on which to compare the results of operations between periods. We believe these
non-GAAP results provide useful information to both management and investors by excluding certain items that impact the comparability of the results.
Reconciliations of net income (loss) per diluted share on a GAAP basis to adjusted net income (loss) per diluted share (non-GAAP basis) are presented in the
table below:
2010 2009 2008 2007 2006
Net income (loss) per diluted share (GAAP basis) $1.08 $0.54 $(1.72) $(0.11) $0.84
Adjustments:
Cumulative breakage gain, net of inventory charge (0.15)
Asset impairment and store closing charges, net of tax 0.06 0.17 0.39 0.07 0.04
Valuation allowance for deferred tax assets – (reversal)/initial (0.13) - 0.46 - -
Adjustments total (0.22) 0.17 0.85 0.07 0.04
Adjusted net income (loss) per diluted share (non-GAAP basis) $0.86 $0.71 $(0.87) $(0.04) $0.88
ITEM 7. MANAGEMENT'S DISCUSSION AND ANALYSIS OF FINANCIAL CONDITION AND RESULTS OF OPERATIONS
Overview
Stein Mart is a national retailer offering the fashion merchandise, service and presentation of a better department or specialty store at
prices competitive with off-price retail chains. Our focused assortment of merchandise features current-season moderate to better
fashion apparel for women and men, as well as accessories, shoes and home fashions.
2010 Highlights
We are pleased to have delivered a strong year of profitability and eight consecutive profitable quarters. For the year ended January
29, 2011, net income was $48.8 million or $1.08 per diluted share compared to net income of $23.6 million or $0.54 per diluted share
in 2009. These results include items that impact comparability, including a $6 million income tax benefit (see “Adjusted Results for
Items Impacting Comparability” and non-GAAP table below). Excluding these items, adjusted net income increased 23.7 percent to
$38.5 million or $0.86 per diluted share compared to $31.1 million or $0.71 per diluted share in 2009.
Operating income for 2010 increased to $53.1 million from $34.6 million in 2009. Excluding store closing and impairment charges in
both years and a net gain recorded in the second quarter of 2010, operating income increased to $47.8 million or 4.0 percent of sales
from $45.7 million or 3.8 percent of sales in 2009 (see non-GAAP table below). The increase in adjusted operating income is the
result of lower selling, general and administrative (“SG&A”) expenses and an increase in other income, partially offset by a reduction
in gross profit.
On the balance sheet, we ended 2010 with $80.2 million in cash compared to $81.0 million in 2009, after payment of a special
dividend totaling $22.2 million or $0.50 per common share in December 2010. We did not use our credit facility in 2010 and had no
debt at year-end. Capital expenditures totaled $29.6 million in 2010 including a $19 million investment in systems which will allow us
to better manage our merchandise and serve our customers.
2011 Outlook
Our focus in 2011 is to increase sales by attracting more customers and build our share of their spending. Our strategic initiatives to
drive sales growth include a continued focus on offering distinctive merchandise at great values and enhancing our marketing to
attract more customers, including younger and Hispanic shoppers. We are making significant progress in expanding our selection of
designer and national brands that are recognized by and resonate with our customers. We continue to reinforce our brand value
proposition with our new tagline “more fashion, less price”. We also continue to plan conservatively including rigorous cost and
inventory management.
We expect the following factors to influence our business in 2011:
x SG&A dollars, excluding store closing and impairment charges, are expected to increase slightly.
x The tax rate for the year is expected to be approximately 39%.
x We plan to open three to five stores, close three to five stores and relocate approximately five stores to better locations in their
respective markets.
x Capital expenditures are expected to be in the range of $25 million to $30 million. These expenditures will be used primarily for
enhancing information systems and for store openings, relocations and remodels.