Southwest Airlines 2011 Annual Report Download - page 10
Download and view the complete annual report
Please find page 10 of the 2011 Southwest Airlines annual report below. You can navigate through the pages in the report by either clicking on the pages listed below, or by using the keyword search tool below to find specific information within the annual report.-
 1
1 -
 2
2 -
 3
3 -
 4
4 -
 5
5 -
 6
6 -
 7
7 -
 8
8 -
 9
9 -
 10
10 -
 11
11 -
 12
12 -
 13
13 -
 14
14 -
 15
15 -
 16
16 -
 17
17 -
 18
18 -
 19
19 -
 20
20 -
 21
21 -
22
-
23
-
24
-
25
-
26
-
27
-
28
-
29
-
30
-
31
-
32
-
33
-
34
-
35
-
36
-
37
-
38
-
39
-
40
-
41
-
42
-
43
-
44
-
45
-
46
-
47
-
48
-
49
-
50
-
51
-
52
-
53
-
54
-
55
-
56
-
57
-
58
-
59
-
60
-
61
-
62
-
63
-
64
-
65
-
66
-
67
-
68
-
69
-
70
-
71
-
72
-
73
-
74
-
75
-
76
-
77
-
78
-
79
-
80
-
81
-
82
-
83
-
84
-
85
-
86
-
87
-
88
-
89
-
90
-
91
-
92
-
93
-
94
-
95
-
96
-
97
-
98
-
99
-
100
-
101
-
102
-
103
-
104
-
105
-
106
-
107
-
108
-
109
-
110
-
111
-
112
-
113
-
114
-
115
-
116
-
117
-
118
-
119
-
120
-
121
-
122
-
123
-
124
-
125
-
126
-
127
-
128
-
129
-
130
-
131
-
132
-
133
-
134
-
135
-
136
-
137
-
138
-
139
-
140
-
141
 |
 |

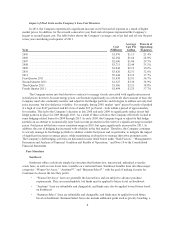
Impact of Fuel Costs on the Company’s Low-Cost Structure
In 2011, the Company experienced a significant increase in its Fuel and oil expense as a result of higher
market prices. In addition, for the seventh consecutive year Fuel and oil expense represented the Company’s
largest or second largest cost. The table below shows the Company’s average cost of jet fuel and oil over the past
seven years and during each quarter of 2011.
Year
Cost
(Millions)
Average
Cost Per
Gallon
Percent of
Operating
Expenses
2005 ....................................................... $1,470 $1.13 21.4%
2006 ....................................................... $2,284 $1.64 28.0%
2007 ....................................................... $2,690 $1.80 29.7%
2008 ....................................................... $3,713 $2.44 35.1%
2009 ....................................................... $3,044 $2.12 30.2%
2010 ....................................................... $3,620 $2.51 32.6%
2011 ....................................................... $5,644 $3.19 37.7%
First Quarter 2011 ............................................ $1,038 $2.91 34.7%
Second Quarter 2011 .......................................... $1,527 $3.30 38.9%
Third Quarter 2011 ........................................... $1,586 $3.23 38.8%
Fourth Quarter 2011 .......................................... $1,494 $3.25 37.7%
The Company enters into fuel derivative contracts to manage its risk associated with significant increases
in fuel prices; however, because energy prices can fluctuate significantly in a relatively short amount of time, the
Company must also continually monitor and adjust its fuel hedge portfolio and strategies to address not only fuel
price increases, but also fuel price volatility. For example, during 2008, market “spot” prices for crude oil peaked
at a high of over $147 per barrel and hit a low of under $35 per barrel – both within a period of approximately
five months. This led to the Company’s decision in late 2008 and early 2009 to significantly reduce its net fuel
hedge position in place for 2009 through 2013. As a result of these activities, the Company effectively locked in
some hedging-related losses for 2009 through 2013. In early 2009, the Company began to adjust its fuel hedge
portfolio in an attempt to economically layer back in some protection in the event of a significant surge in market
prices. Fuel prices settled into a more consistent range in 2010, but again significantly increased for 2011. In
addition, the cost of hedging has increased with volatility in the fuel market. Therefore, the Company continues
to actively manage its fuel hedge portfolio to address volatile fuel prices and, in particular, to mitigate the impact
of significant increases in energy prices, while maintaining an objective to manage derivative premium costs.
The Company’s fuel hedging activities are discussed in more detail below under “Risk Factors,” “Management’s
Discussion and Analysis of Financial Condition and Results of Operations,” and Note 10 to the Consolidated
Financial Statements.
Fare Structure
Southwest
Southwest offers a relatively simple fare structure that features low, unrestricted, unlimited, everyday
coach fares, as well as even lower fares available on a restricted basis. Southwest bundles fares into three major
categories: “Wanna Get Away,” “AnytimeSM,” and “Business Select®,” with the goal of making it easier for
Customers to choose the fare they prefer.
• “Wanna Get Away” fares are generally the lowest fares and are subject to advance purchase
requirements. They are nonrefundable, but funds may be applied to future travel on Southwest.
• “Anytime” fares are refundable and changeable, and funds may also be applied toward future travel
on Southwest.
• “Business Select” fares are refundable and changeable, and funds may be applied toward future
travel on Southwest. Business Select fares also include additional perks such as priority boarding, a
4