Sonic 2004 Annual Report Download - page 13
Download and view the complete annual report
Please find page 13 of the 2004 Sonic annual report below. You can navigate through the pages in the report by either clicking on the pages listed below, or by using the keyword search tool below to find specific information within the annual report.-
 1
1 -
2
-
 3
3 -
 4
4 -
 5
5 -
 6
6 -
 7
7 -
 8
8 -
 9
9 -
 10
10 -
 11
11 -
 12
12 -
 13
13 -
 14
14 -
 15
15 -
 16
16 -
 17
17 -
 18
18 -
 19
19 -
 20
20 -
 21
21 -
 22
22 -
 23
23 -
24
-
25
-
26
-
27
-
28
-
29
-
30
-
31
-
32
-
33
-
34
-
35
-
36
-
37
-
38
-
39
-
40
 |
 |

Overview
Description of the Business.Sonic operates and franchises the largest chain of drive-
ins in the United States and also has a small number of Franchise Drive-Ins in Mexico. As
of August 31, 2004, the Sonic system was comprised of 2,885 drive-ins, of which 539 were
Partner Drive-Ins and 2,346 were Franchise Drive-Ins. Sonic Drive-Ins feature Sonic
signature items such as made-to-order sandwiches and hamburgers, extra-long cheese
coneys, salads,hand-battered onion rings, tater tots, specialty soft drinks including cherry
limeades and slushes,and frozen desserts. We derive our revenues primarily from Partner
Drive-In sales and royalty fees from franchisees. We also receive revenues from initial
franchise fees and the selling and leasing of signs and real estate. In addition, we also own
and receive income from a minority ownership interest in a few Franchise Drive-Ins.
Costs of Partner Drive-In sales, including minority interest in earnings of drive-ins,
relate directly to Partner Drive-In sales. Other expenses, such as depreciation,
amortization, and general and administrative expenses, relate to Partner Drive-In
operations, as well as the Company’s franchising operations. Our revenues and expenses
are directly affected by the number and sales volumes of Partner Drive-Ins. Our revenues
and, to a lesser extent, expenses also are affected by the number and sales volumes of
Franchise Drive-Ins. Initial franchise fees and franchise royalties are directly affected by
the number of Franchise Drive-In openings.
Overview of Business Performance. Business performance was strong during fiscal
year 2004 as net income increased 20.6% and earnings per share increased 18.6% to
$1.02 per diluted share. We continue to experience considerable momentum in our
business fueled by strong growth in same-store sales that, despite some pressure on
commodity costs during the year, led to a significant increase in system-wide average
profit per store. The rise in store-level profits, in turn, helped produce a record number of
new drive-in openings by franchisees. We believe these results reflect our multi-layered
growth strategy that features the following components:
• Solid same-store sales growth,
•Increased franchising income stemming from our unique ascending royalty rate,
• Expansion of the Sonic brand through new unit growth particularly by franchisees,
• Operating leverage at both the drive-in level and the corporate level, and
• The use of excess operating cash flow for franchise acquisitions and share
repurchases.
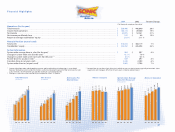
The following table provides information regarding the number of Partner Drive-Ins
and Franchise Drive-Ins in operation as of the end of the periods indicated as well as the
system-wide growth in sales and average unit volume.System-wide information includes
both Partner Drive-In and Franchise Drive-In information, which we believe is useful in
analyzing the growth of the brand as well as the Company’s revenues since franchisees
pay royalties based on a percentage of sales.
System-Wide Performance
Year Ended August 31,
2004 2003 2002
($ in thousands)
Percentage increase in sales 13.1% 7.0 % 11.9%
System-wide drive-ins in operation:
Total at beginning of period 2,706 2,533 2,359
Opened 188 194 182
Closed (net of re-openings) (9) (21) (8)
Total at end of period 2,885 2,706 2,533
Core markets 2,059 1,977 1,888
Developing markets 826 729 645
All markets 2,885 2,706 2,533
Average sales per drive-in:
Core markets $ 1,004 $ 947 $ 939
Developing markets 861 802 819
All markets 964 907 906
Change in same-store sales – new method (1):
Core markets 6.4 % 0.5 % 4.4%
Developing markets 6.8 (1.2) (0.4)
All markets 6.5 0.3 3.5
Change in same-store sales – prior method (2):
Core markets 6.4 % 1.1 % 4.3%
Developing markets 5.1 (5.1) (2.3)
All markets 6.1 (0.3) 3.0
(1) Represents percentage change for drive-ins open for a minimum of 15 months.
(2) Represents percentage change for drive-ins open for a minimum of 12 months.
System-wide same-store sales increased 6.5% during fiscal year 2004, primarily as a
result of traffic growth (an increase in the number of transactions) across all day parts (e.g.
morning, lunch, afternoon, dinner, and evening). We believe this strong sales performance
was not only the result of generally more favorable industry and consumer conditions but
was also a consequence of our specific sales driving initiatives including:
Management's Discussion and Analysis of Financial Condition and Results of Operations
p.11