Singapore Airlines 2015 Annual Report Download - page 57
Download and view the complete annual report
Please find page 57 of the 2015 Singapore Airlines annual report below. You can navigate through the pages in the report by either clicking on the pages listed below, or by using the keyword search tool below to find specific information within the annual report.-
 1
1 -
2
-
3
-
4
-
5
-
6
-
7
-
8
-
9
-
10
-
11
-
12
-
13
-
14
-
15
-
16
-
17
-
18
-
19
-
20
-
21
-
22
-
23
-
24
-
25
-
26
-
27
-
28
-
29
-
30
-
31
-
32
-
33
-
34
-
35
-
36
-
37
-
38
-
39
-
40
-
41
-
42
-
43
-
44
-
45
-
46
-
 47
47 -
 48
48 -
 49
49 -
 50
50 -
 51
51 -
 52
52 -
 53
53 -
 54
54 -
 55
55 -
 56
56 -
 57
57 -
 58
58 -
 59
59 -
 60
60 -
 61
61 -
 62
62 -
 63
63 -
 64
64 -
 65
65 -
 66
66 -
 67
67 -
68
-
69
-
70
-
71
-
72
-
73
-
74
-
75
-
76
-
77
-
78
-
79
-
80
-
81
-
82
-
83
-
84
-
85
-
86
-
87
-
88
-
89
-
90
-
91
-
92
-
93
-
94
-
95
-
96
-
97
-
98
-
99
-
100
-
101
-
102
-
103
-
104
-
105
-
106
-
107
-
108
-
109
-
110
-
111
-
112
-
113
-
114
-
115
-
116
-
117
-
118
-
119
-
120
-
121
-
122
-
123
-
124
-
125
-
126
-
127
-
128
-
129
-
130
-
131
-
132
-
133
-
134
-
135
-
136
-
137
-
138
-
139
-
140
-
141
-
142
-
143
-
144
-
145
-
146
-
147
-
148
-
149
-
150
-
151
-
152
-
153
-
154
-
155
-
156
-
157
-
158
-
159
-
160
-
161
-
162
-
163
-
164
-
165
-
166
-
167
-
168
-
169
-
170
-
171
-
172
-
173
-
174
-
175
-
176
-
177
-
178
-
179
-
180
-
181
-
182
-
183
-
184
-
185
-
186
-
187
-
188
-
189
-
190
-
191
-
192
-
193
-
194
-
195
-
196
-
197
-
198
-
199
-
200
-
201
-
202
-
203
-
204
-
205
-
206
-
207
-
208
-
209
-
210
-
211
-
212
-
213
-
214
-
215
-
216
-
217
-
218
-
219
-
220
-
221
-
222
-
223
-
224
 |
 |

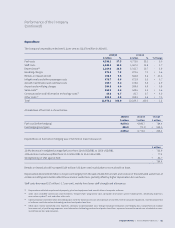
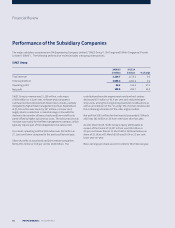
Expenditure
The Company’s expenditure declined 1.2 per cent to $12,078 million in 2014/15.
Rentals on leased aircra increased $134 million (+23.6 per cent) mainly due to more aircra on lease.
Depreciation declined $48 million (-3.6 per cent) largely from the sale of A340-500 aircra, and revision of the estimated useful lives of
certain aircra types to better reflect the economic useful lives, partially oset by higher depreciation for overhauls.
Sta costs decreased $27 million (-1.7 per cent), mainly from lower sta strength and allowances.
R6 Depreciation included impairment of property, plant and equipment and amortisation of computer soware.
R7 Sales costs included commission and incentives, frequent flyer programme cost, computer reservation system booking fees, advertising expenses,
reservation system IT cost and other sales costs.
R8 Communication and information technology costs were for data transmission and contract service fees, hire of computer equipment, maintenance/rental
of soware, and information technology contract and professional fees.
R9 Other costs mainly comprised crew expenses, company accommodation cost, foreign exchange revaluation and hedging loss, comprehensive aviation
insurance cost, airport lounge expenses, non-information technology contract and professional fees, expenses incurred to mount non-scheduled services,
aircra licence fees and recoveries.
2014/15 2013/14
$ million % $ million % % Change
Fuel costs 4,536.2 37.5 4,772.6 39.1 - 5.0
Sta costs 1,540.2 12.8 1,567.0 12.8 - 1.7
Depreciation R6 1,264.0 10.5 1,311.7 10.7 - 3.6
Handling charges 876.2 7.3 870.6 7.1 + 0.6
Rentals on leased aircra 698.3 5.8 564.8 4.6 + 23.6
Inflight meals and other passenger costs 676.7 5.6 671.8 5.5 + 0.7
Aircra maintenance and overhaul costs 655.7 5.4 675.6 5.5 - 2.9
Airport and overflying charges 594.8 4.9 599.4 4.9 - 0.8
Sales costs R7 552.9 4.6 549.6 4.5 + 0.6
Communication and information technology costs R8 85.0 0.7 81.7 0.7 + 4.0
Other costs R9 598.2 4.9 559.3 4.6 + 7.0
Total 12,078.2 100.0 12,224.1 100.0 - 1.2
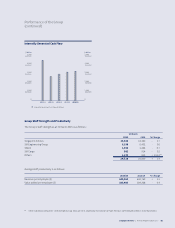
A breakdown of fuel cost is shown below:
2014/15 2013/14 Change
$ million $ million $ million
Fuel cost (before hedging) 4,079.3 4,843.7 - 764.4
Fuel hedging loss/(gain) 456.9 (71.1) + 528.0
4,536.2 4,772.6 - 236.4
Expenditure on fuel before hedging was $764 million lower because of:
$ million
15.4% decrease in weighted average fuel price from 124.8 USD/BBL to 105.6 USD/BBL - 733.9
1.9% decline in volume uplied from 31.0 million BBL to 30.4 million BBL - 77.2
Strengthening of USD against SGD + 46.7
- 764.4
Performance of the Company
(continued)
Singapore Airlines | Annual Report FY2014/15 | 55