Singapore Airlines 2012 Annual Report Download - page 80
Download and view the complete annual report
Please find page 80 of the 2012 Singapore Airlines annual report below. You can navigate through the pages in the report by either clicking on the pages listed below, or by using the keyword search tool below to find specific information within the annual report.-
 1
1 -
2
-
3
-
4
-
5
-
6
-
7
-
8
-
9
-
10
-
11
-
12
-
13
-
14
-
15
-
16
-
17
-
18
-
19
-
20
-
21
-
22
-
23
-
24
-
25
-
26
-
27
-
28
-
29
-
30
-
31
-
32
-
33
-
34
-
35
-
36
-
37
-
38
-
39
-
40
-
41
-
42
-
43
-
44
-
45
-
46
-
47
-
48
-
49
-
50
-
51
-
52
-
53
-
54
-
55
-
56
-
57
-
58
-
59
-
60
-
61
-
62
-
63
-
64
-
65
-
66
-
67
-
68
-
69
-
 70
70 -
 71
71 -
 72
72 -
 73
73 -
 74
74 -
 75
75 -
 76
76 -
 77
77 -
 78
78 -
 79
79 -
 80
80 -
 81
81 -
 82
82 -
 83
83 -
 84
84 -
 85
85 -
 86
86 -
 87
87 -
 88
88 -
 89
89 -
 90
90 -
91
-
92
-
93
-
94
-
95
-
96
-
97
-
98
-
99
-
100
-
101
-
102
-
103
-
104
-
105
-
106
-
107
-
108
-
109
-
110
-
111
-
112
-
113
-
114
-
115
-
116
-
117
-
118
-
119
-
120
-
121
-
122
-
123
-
124
-
125
-
126
-
127
-
128
-
129
-
130
-
131
-
132
-
133
-
134
-
135
-
136
-
137
-
138
-
139
-
140
-
141
-
142
-
143
-
144
-
145
-
146
-
147
-
148
-
149
-
150
-
151
-
152
-
153
-
154
-
155
-
156
-
157
-
158
-
159
-
160
-
161
-
162
-
163
-
164
-
165
-
166
-
167
-
168
-
169
-
170
-
171
-
172
-
173
-
174
-
175
-
176
-
177
-
178
-
179
-
180
-
181
-
182
-
183
-
184
-
185
-
186
-
187
-
188
-
189
-
190
-
191
-
192
-
193
-
194
-
195
-
196
-
197
-
198
-
199
-
200
-
201
-
202
-
203
-
204
-
205
-
206
 |
 |

078 SINGAPORE AIRLINES
Financial Review
Performance of the Subsidiary Companies (continued)
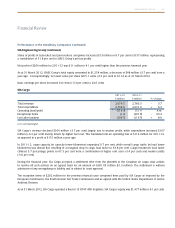
SilkAir
2011-12 2010-11
$million $million %Change
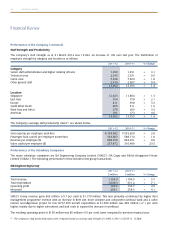
Total revenue 750.8 670.3 + 12.0
Total expenditure 646.2 548.9 + 17.7
Operating profit 104.6 121.4 - 13.8
Profit after taxation 84.9 103.8 - 18.2
SilkAir’s revenue increased $80 million (+12.0 per cent) to $751 million, from improvements in both load (+9.0 per cent) and
yield (+4.0 per cent). Expenditure was up $97 million (+17.7 per cent), primarily due to higher fuel costs. As a result, operating
profit fell 13.8 per cent to $105 million.
Yield improved by 4.0 per cent to 153.3 cents/ltk, while unit cost increased at a faster rate of 8.5 per cent to 91.5 cents/ctk.
Consequently, the breakeven load factor rose 2.5 percentage points to 59.7 per cent.
Profit after taxation of $85 million was 18.2 per cent lower.
SilkAir’s route network spanned 39 cities in 12 countries. During the year, SilkAir launched new services to Bandung (Indonesia),
Changsha (China), Darwin (Australia), Koh Samui (Thailand) and Kolkata (India).
As at 31 March 2012, SilkAir’s equity stood at $693 million (+13.9 per cent).