Sennheiser 2014 Annual Report Download - page 7
Download and view the complete annual report
Please find page 7 of the 2014 Sennheiser annual report below. You can navigate through the pages in the report by either clicking on the pages listed below, or by using the keyword search tool below to find specific information within the annual report.-
 1
1 -
 2
2 -
 3
3 -
 4
4 -
 5
5 -
 6
6 -
 7
7 -
 8
8 -
 9
9 -
 10
10 -
 11
11 -
 12
12 -
 13
13
 |
 |
CONSOLIDATED MANAGEMENT REPORT 2014CONSOLIDATED MANAGEMENT REPORT 2014
2.3 POSITION OF THE SENNHEISER GROUP
2.3.1 Net Earnings Position
The Sennheiser Group’s sales increased by €30.0 million in fiscal year 2014 to a total of €50.6 million. Expendi-
tures for materials and human resources increased in this context. However, other cost items were able to be
maintained at the previous year’s level. Therefore, the increased earnings can be traced back to improved
company performance coupled with only a slight increase in expenditures.
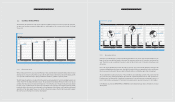
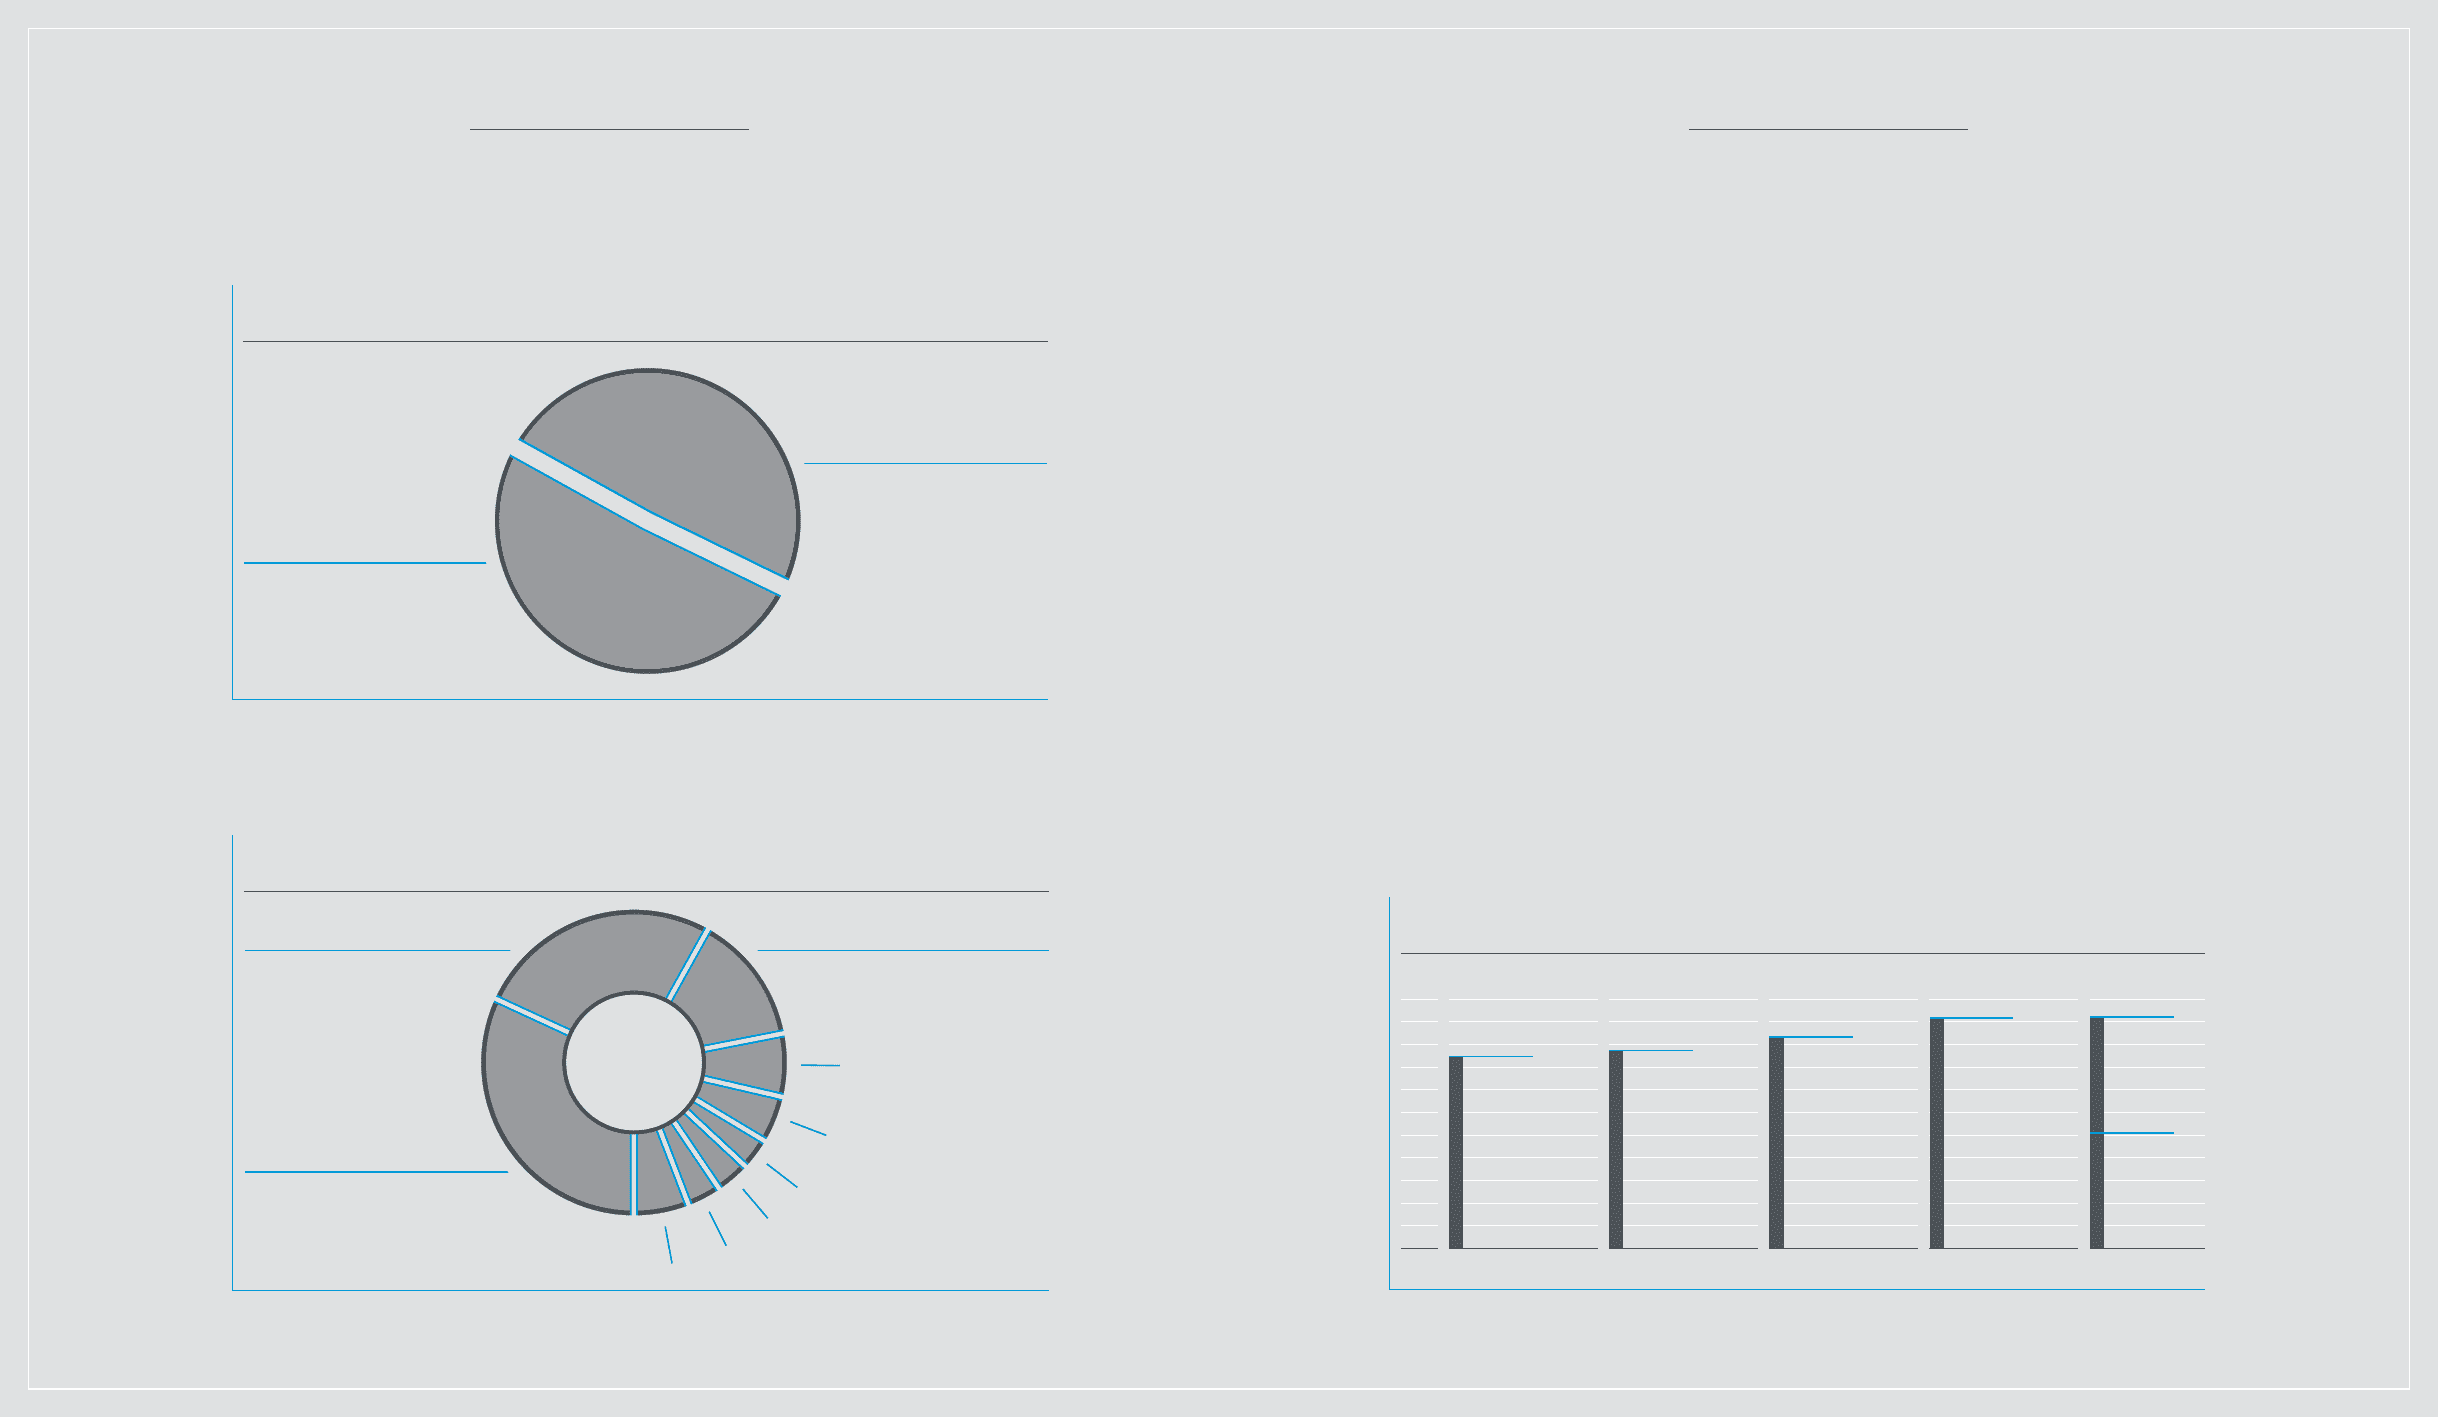
2.3.2 Staff growth
Personnel costs grew by 8.1 percent over the previous year. This can be attributed both to the increase in
employee profit sharing due to the improved earnings situation as well as the rise in the number of employees.
The annual average staff level at the Sennheiser Group increased by 2.3 percent to 2,600 employees in 2014,
including 76 trainees (previous year: 78). Part-time employees were counted as 0.5 and full-time employees as
1 to determine the number of personnel. At the end of the year, the number of employees at the Sennheiser
Group was 2,707 (previous year: 2,620). On average, 51 percent of all employees worked at companies in Germany
and 49 percent at companies abroad.
EMPLOYEES
Annual average number of employees
change from previous year, in percent
2,500
2,000
1,500
1,000
500
0
2010 2011 2012 2013 2014
2,117
–0.7 %
2,183
+3.1 %
2,542
+9.1 %
2,329
+6.7 %
1,281
Abroad
49 %
2,600
+2.3 %
1,319
Germany
51 %
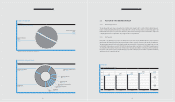
REVENUE BY PRODUCT GROUP
€ millions / %
Headphones
202.9 32.0 %
Wireless microphones
166.6 26.2 % Sennheiser Communications
88.1 13.9 %
Wired microphones
42.7 6.7 %
Audiology
30.8 4.9 %
Professional headphones
21.5 3.4 %
Georg Neumann
23.5 3.7 %
Information & Communication
23.1 3.6 %
Other
35.6 5.6 %
1312
REVENUE BY DIVISION
€ millions / %
change from previous year, in percent
*Integrated Systems in Professional Systems starting in 2014
Consumer Division
322.0
50.7 %
+7. 1 %
Professional Systems
312.8
49.3 %
+7.9 %
*